Đây là phần cuối cùng về PyQtGraph trong chuỗi bài hướng dẫn, nó vẫn còn nhiều loại chart khác nhau rất đẹp và phong phú, các bạn tự tìm hiểu thêm. Đặc biệt PyQtGraph hỗ trợ cả 3D tương tác rất đẹp và chuyên nghiệp, nhưng vì thời gian có hạn nên Tui không thể giới thiệu tiếp, mà các bài học khác Tui sẽ chuyển qua Lập trình đa tiến trình để cập nhật giao diện thời gian thực được mượt nhất.
Bài học này ta sẽ làm Custom BarGraphItem bằng cách tạo ra một lớp kế thừa từ BarGraphItem. Mục đích của việc này là cung cấp khả năng tương tự sự kiện trực tiếp trên từng BarItem để hỗ trợ cho việc thống kê cũng như xem chi tiết được tốt nhất.
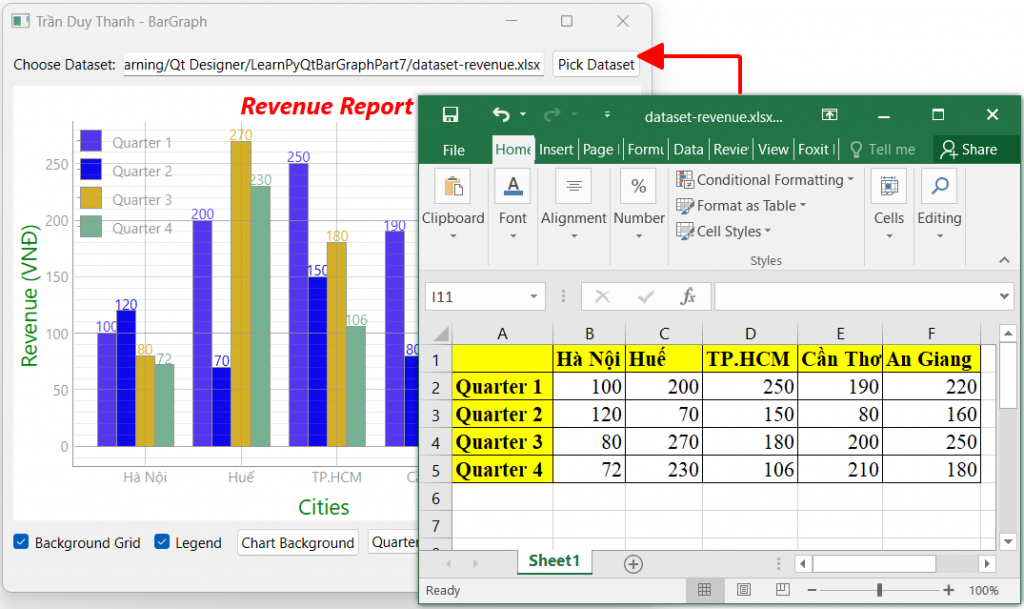
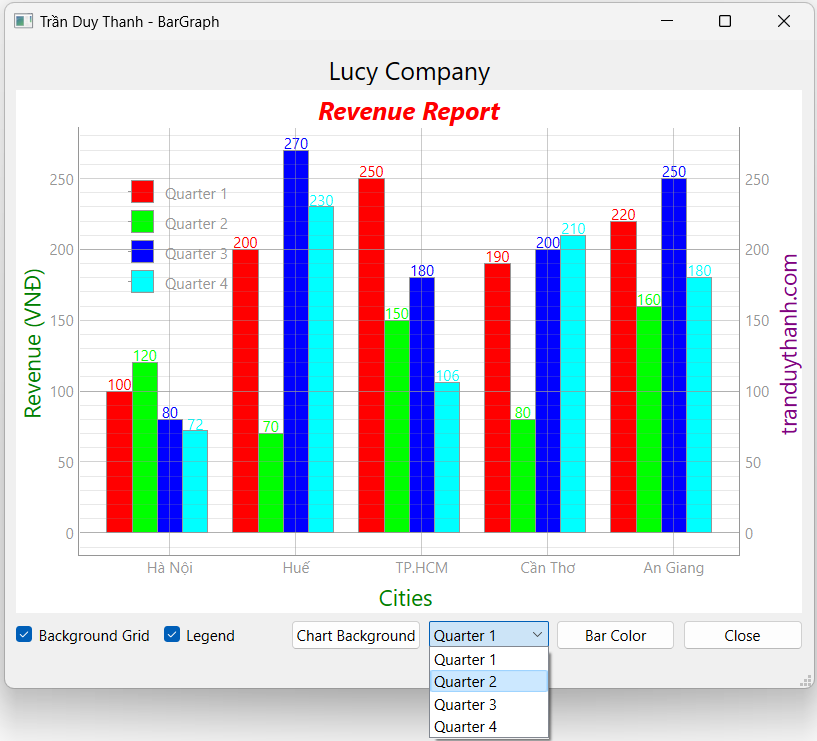
Bài này xử lý y chang như bài 37, nó chỉ khác ở chỗ ta làm CustomBarGraphItem và xử lý sự kiện cho các Bar item này, khi nhấn vào Bar Item nó sẽ tô nền vàng, khi nhấn qua bar item khác thì nó được phục hồi lại màu cũ.
Ta làm theo các bước dưới đây.
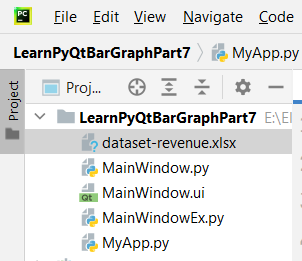
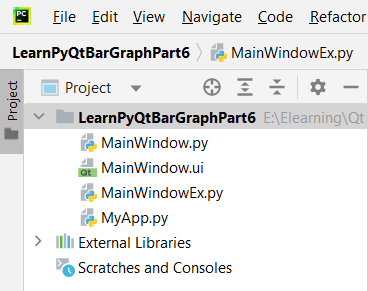
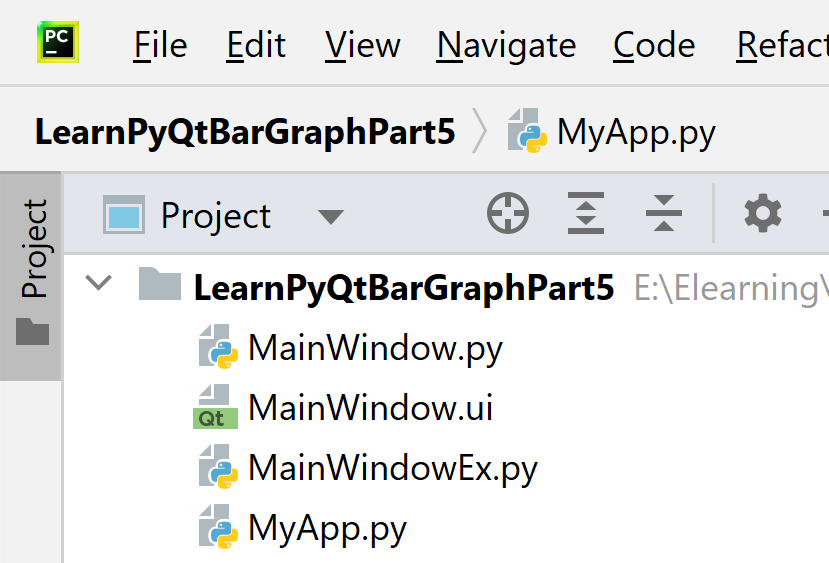
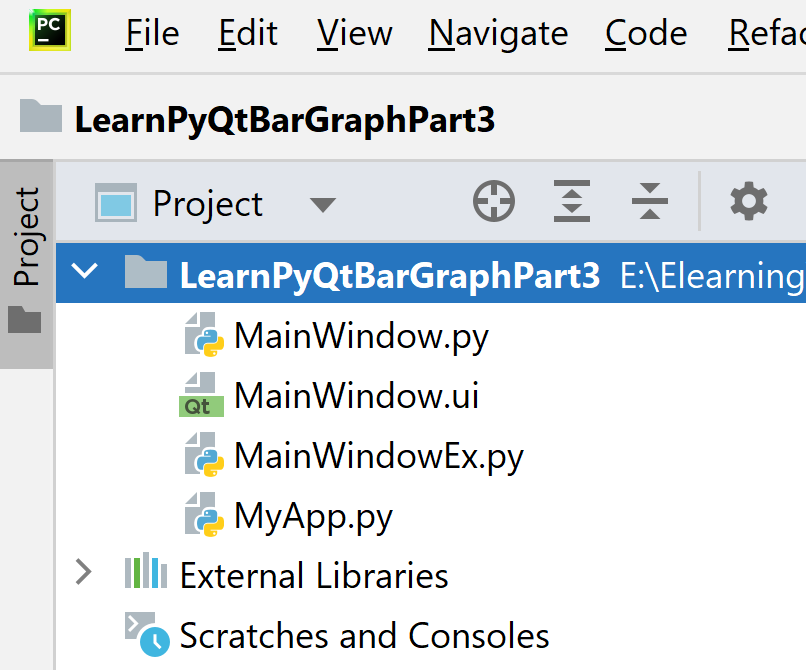
Bước 1: Tạo dự án tên “LearnPyQtBarGraphPart8” có cấu trúc như dưới đây:
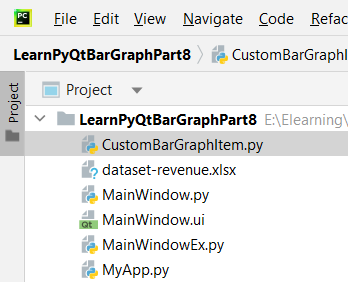
- “dataset-revenue.xlsx” là file Excel mẫu của dự án
- “CustomBarGraphItem.py” là lớp kế thừa từ BarGraphItem để làm Custom Bar Item, xử lý người dùng tương tác trực tiếp trên Bar Item
- “MainWindow.ui” là giao diện thiết kế tương tác người dùng bằng Qt Designer
- “MainWindow.py” là Generate Python code cho giao diện “MainWindow.ui”
- “MainWindowEx.py” là file mã lệnh kế thừa từ Generate Python Code để xử lý: Nạp giao diện, hiển thị chart, gán sự kiện và không bị lệ thuộc vào giao diện bị thay đổi sau này khi Generate lại code
- “MyApp.py” là file mã lệnh thực thi chương trình.
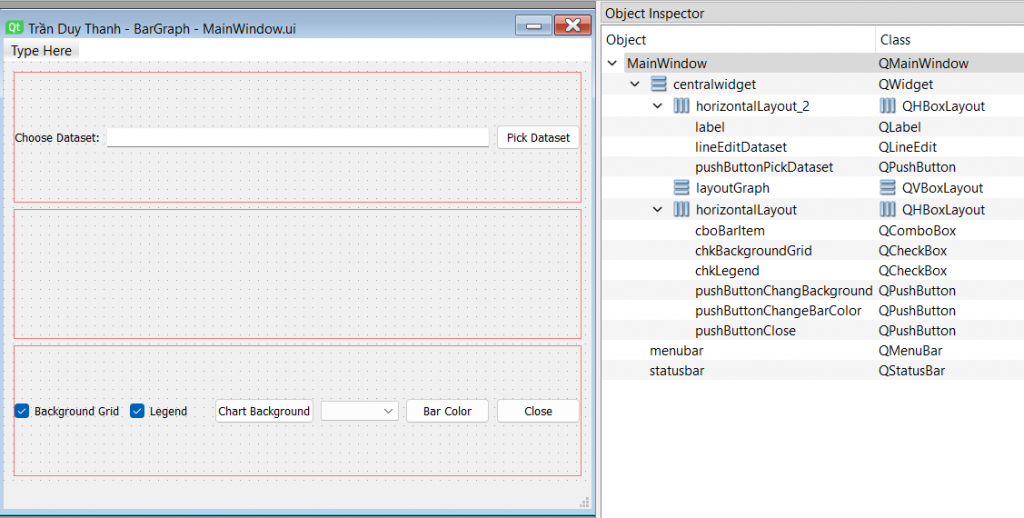
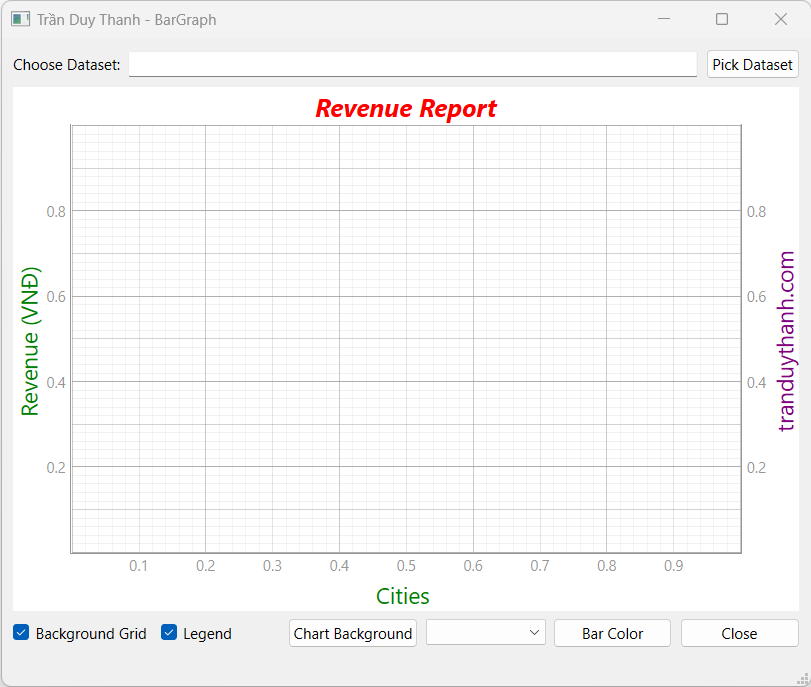
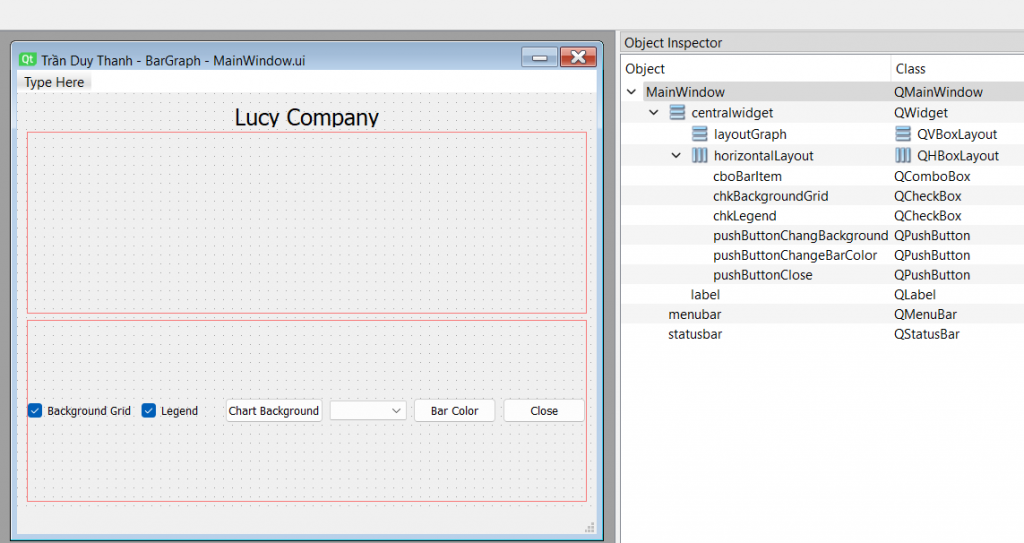
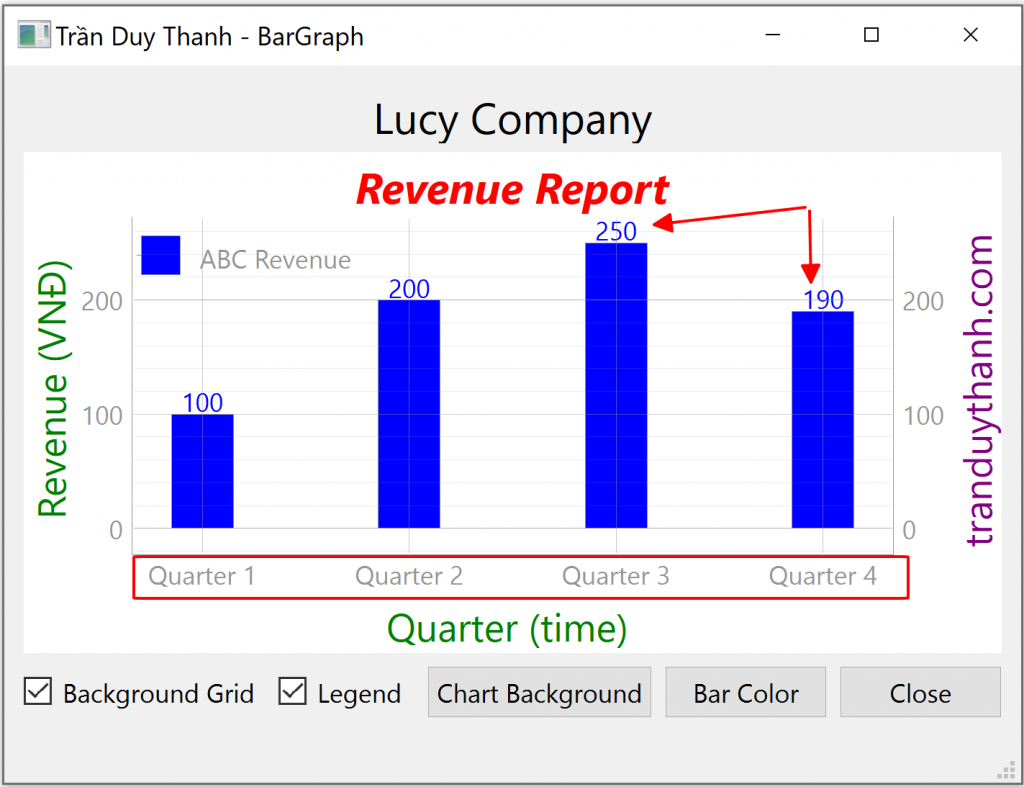
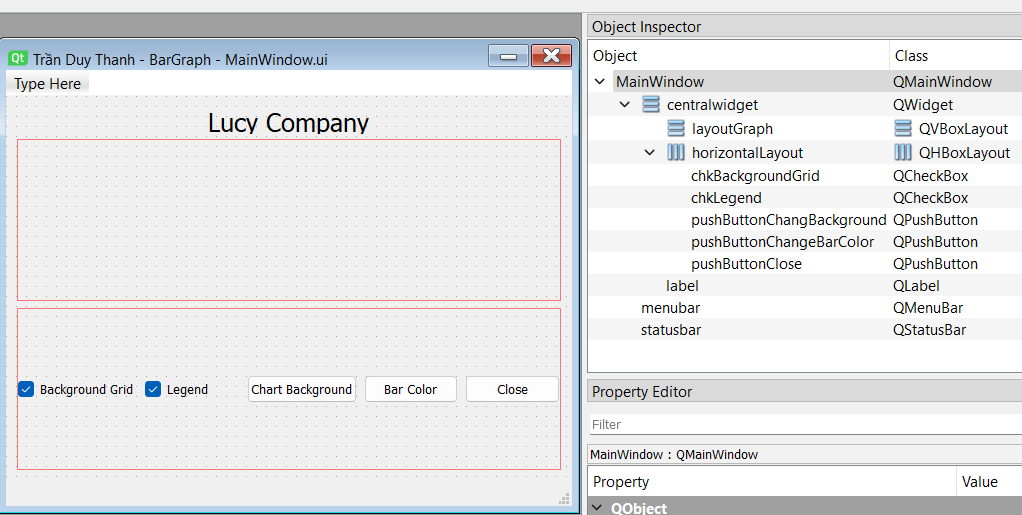
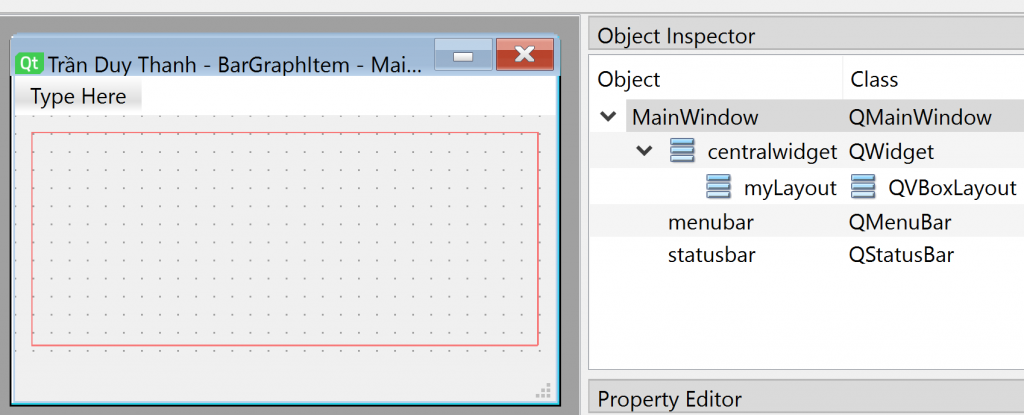
Bước 2: Thiết kế giao diện “MainWindow.ui” và đặt tên cho Widget/layout như hình dưới đây:
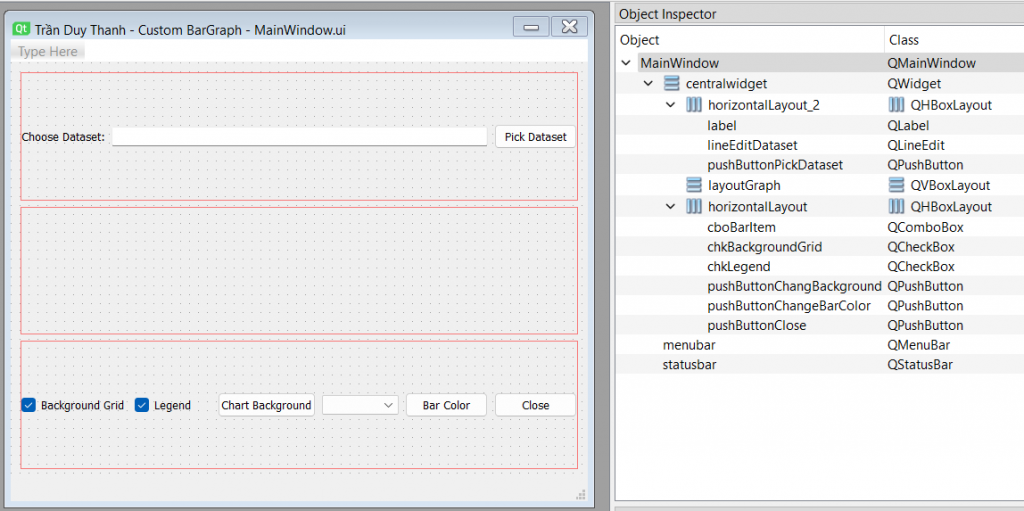
Bạn lần lượt kéo thả các Widget vào giao diện như trên, lưu ý việc lựa chọn các Layout cho phù hợp.
Bạn lưu ý trong bài này Tui bổ sung nhóm QHBoxLayout ở bên trên để chọn Dataset là file Excel.
Bước 3: Generate Python Code cho “MainWindow.ui”, lúc này mã lệnh “MainWindow.py” tự động được tạo ra:
# Form implementation generated from reading ui file 'MainWindow.ui'
#
# Created by: PyQt6 UI code generator 6.4.2
#
# WARNING: Any manual changes made to this file will be lost when pyuic6 is
# run again. Do not edit this file unless you know what you are doing.
from PyQt6 import QtCore, QtGui, QtWidgets
class Ui_MainWindow(object):
def setupUi(self, MainWindow):
MainWindow.setObjectName("MainWindow")
MainWindow.resize(647, 518)
self.centralwidget = QtWidgets.QWidget(parent=MainWindow)
self.centralwidget.setObjectName("centralwidget")
self.verticalLayout_2 = QtWidgets.QVBoxLayout(self.centralwidget)
self.verticalLayout_2.setObjectName("verticalLayout_2")
self.horizontalLayout_2 = QtWidgets.QHBoxLayout()
self.horizontalLayout_2.setObjectName("horizontalLayout_2")
self.label = QtWidgets.QLabel(parent=self.centralwidget)
self.label.setObjectName("label")
self.horizontalLayout_2.addWidget(self.label)
self.lineEditDataset = QtWidgets.QLineEdit(parent=self.centralwidget)
self.lineEditDataset.setObjectName("lineEditDataset")
self.horizontalLayout_2.addWidget(self.lineEditDataset)
self.pushButtonPickDataset = QtWidgets.QPushButton(parent=self.centralwidget)
self.pushButtonPickDataset.setObjectName("pushButtonPickDataset")
self.horizontalLayout_2.addWidget(self.pushButtonPickDataset)
self.verticalLayout_2.addLayout(self.horizontalLayout_2)
self.layoutGraph = QtWidgets.QVBoxLayout()
self.layoutGraph.setSizeConstraint(QtWidgets.QLayout.SizeConstraint.SetDefaultConstraint)
self.layoutGraph.setObjectName("layoutGraph")
self.verticalLayout_2.addLayout(self.layoutGraph)
self.horizontalLayout = QtWidgets.QHBoxLayout()
self.horizontalLayout.setObjectName("horizontalLayout")
self.chkBackgroundGrid = QtWidgets.QCheckBox(parent=self.centralwidget)
self.chkBackgroundGrid.setChecked(True)
self.chkBackgroundGrid.setObjectName("chkBackgroundGrid")
self.horizontalLayout.addWidget(self.chkBackgroundGrid)
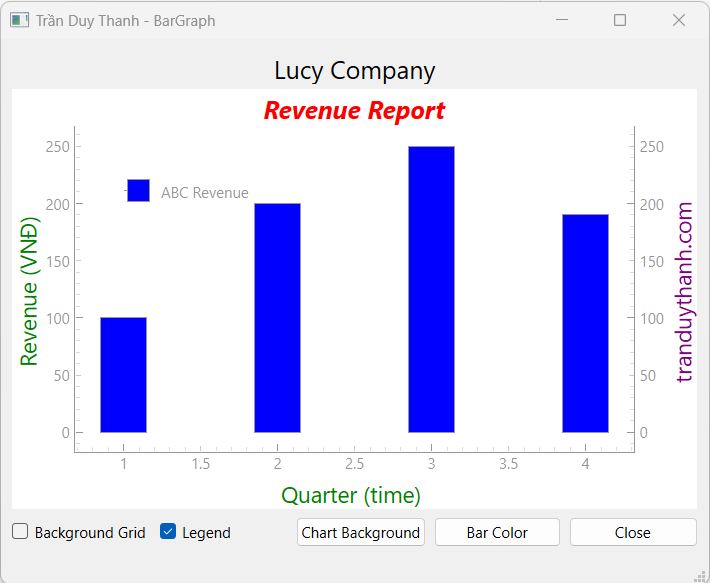
self.chkLegend = QtWidgets.QCheckBox(parent=self.centralwidget)
self.chkLegend.setChecked(True)
self.chkLegend.setObjectName("chkLegend")
self.horizontalLayout.addWidget(self.chkLegend)
self.pushButtonChangBackground = QtWidgets.QPushButton(parent=self.centralwidget)
self.pushButtonChangBackground.setObjectName("pushButtonChangBackground")
self.horizontalLayout.addWidget(self.pushButtonChangBackground)
self.cboBarItem = QtWidgets.QComboBox(parent=self.centralwidget)
self.cboBarItem.setObjectName("cboBarItem")
self.horizontalLayout.addWidget(self.cboBarItem)
self.pushButtonChangeBarColor = QtWidgets.QPushButton(parent=self.centralwidget)
self.pushButtonChangeBarColor.setObjectName("pushButtonChangeBarColor")
self.horizontalLayout.addWidget(self.pushButtonChangeBarColor)
self.pushButtonClose = QtWidgets.QPushButton(parent=self.centralwidget)
self.pushButtonClose.setObjectName("pushButtonClose")
self.horizontalLayout.addWidget(self.pushButtonClose)
self.verticalLayout_2.addLayout(self.horizontalLayout)
MainWindow.setCentralWidget(self.centralwidget)
self.menubar = QtWidgets.QMenuBar(parent=MainWindow)
self.menubar.setGeometry(QtCore.QRect(0, 0, 647, 26))
self.menubar.setObjectName("menubar")
MainWindow.setMenuBar(self.menubar)
self.statusbar = QtWidgets.QStatusBar(parent=MainWindow)
self.statusbar.setObjectName("statusbar")
MainWindow.setStatusBar(self.statusbar)
self.retranslateUi(MainWindow)
self.pushButtonClose.clicked.connect(MainWindow.close) # type: ignore
QtCore.QMetaObject.connectSlotsByName(MainWindow)
def retranslateUi(self, MainWindow):
_translate = QtCore.QCoreApplication.translate
MainWindow.setWindowTitle(_translate("MainWindow", "Trần Duy Thanh - Custom BarGraph"))
self.label.setText(_translate("MainWindow", "Choose Dataset:"))
self.pushButtonPickDataset.setText(_translate("MainWindow", "Pick Dataset"))
self.chkBackgroundGrid.setText(_translate("MainWindow", "Background Grid"))
self.chkLegend.setText(_translate("MainWindow", "Legend"))
self.pushButtonChangBackground.setText(_translate("MainWindow", "Chart Background"))
self.pushButtonChangeBarColor.setText(_translate("MainWindow", "Bar Color"))
self.pushButtonClose.setText(_translate("MainWindow", "Close"))
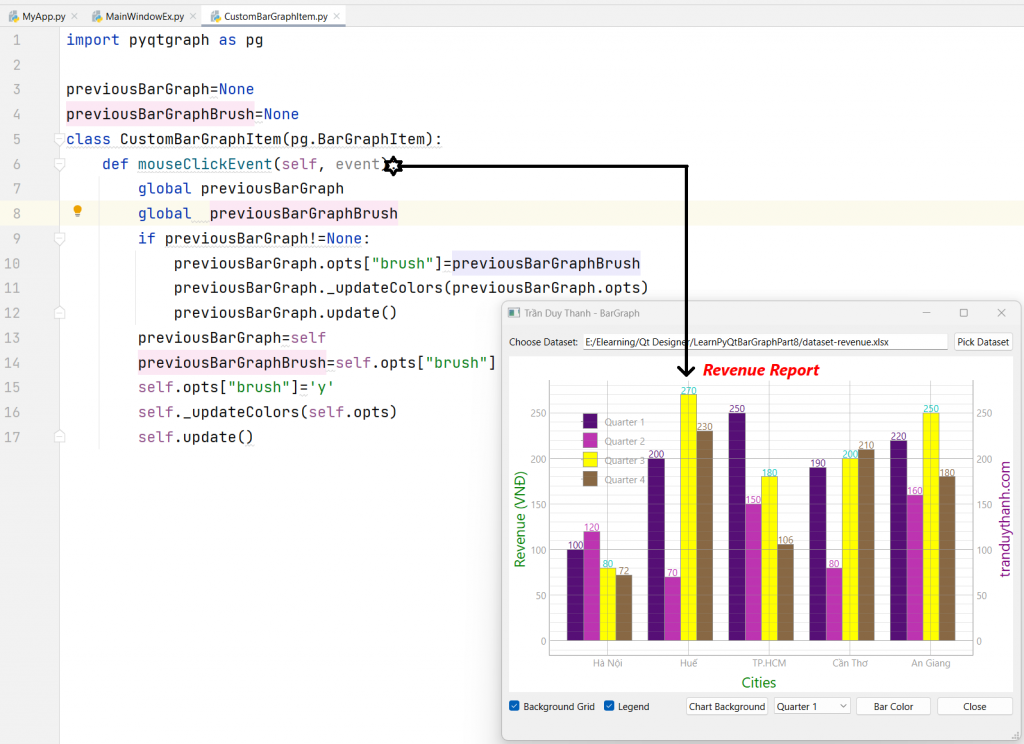
Bước 4: Viết mã lệnh cho “CustomBarGraphItem.py”
import pyqtgraph as pg

previousBarGraph=None
previousBarGraphBrush=None
class CustomBarGraphItem(pg.BarGraphItem):
    def mouseClickEvent(self, event):
        global previousBarGraph
        global  previousBarGraphBrush
        if previousBarGraph!=None:
            previousBarGraph.opts["brush"]=previousBarGraphBrush
            previousBarGraph._updateColors(previousBarGraph.opts)
            previousBarGraph.update()
        previousBarGraph=self
        previousBarGraphBrush=self.opts["brush"]
        self.opts["brush"]='y'
        self._updateColors(self.opts)
        self.update()
Lớp CustomBarGraphItem kế thừa từ BarGraphItem.
Lớp này khai báo 2 global veriable:
- previousBarGraph để lưu lại BarItem nào được click trước đó
- previousBarGraphBrush để lưu lại màu của BarItem được click trước đó
2 biến này dùng để phục hồi lại trạng thái ban đầu khi người dùng chọn qua Bar item khác.
Và ta override phương thức mouseClickEvent, sự kiện này sẽ kiểm tra BarItem nào đang được click để đổi màu, ta dùng hàm _updateColors() để đổi màu
Bước 5: Viết mã lệnh cho “MainWindowEx.py”
Lưu ý lớp này mã lệnh y chang như bài 37, Tui chỉ thay thế chỗ sử dụng CustomBarrGraphItem mà thôi, vì vậy Tui không giải thích chi tiết từng thành phần nữa, mà Tui gửi đầy đủ coding ở đây, cuối coding Tui giải thích sơ lược cách dùng CustomBarGraphItem:
from PyQt6.QtCore import Qt, QPointF
from PyQt6.QtWidgets import QColorDialog, QFileDialog
from CustomBarGraphItem import CustomBarGraphItem
from MainWindow import Ui_MainWindow
import numpy as np
import pyqtgraph as pg
import pandas as pd
import random as nd
class MainWindowEx(Ui_MainWindow):
def __init__(self):
super().__init__()
def setupUi(self, MainWindow):
super().setupUi(MainWindow)
self.MainWindow=MainWindow
self.setupBarGraph()
self.setupSignal()
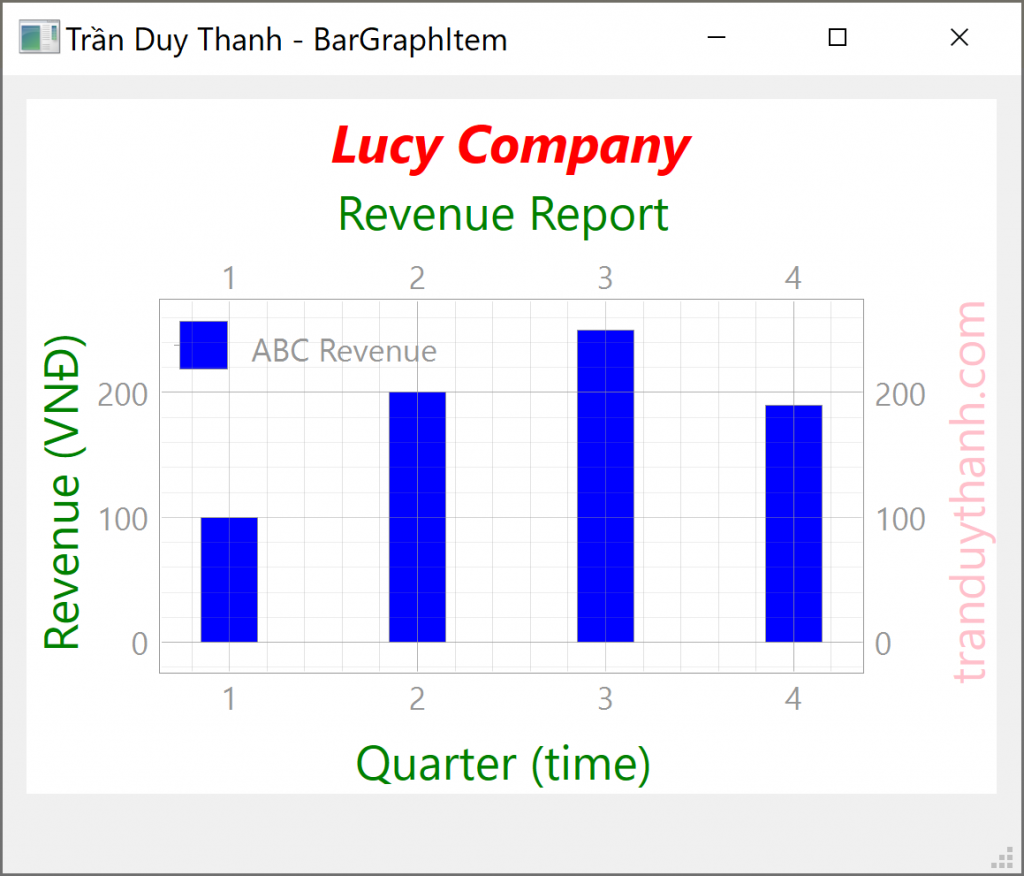
def setupBarGraph(self):
self.graphWidget = pg.PlotWidget()
self.graphWidget.setTitle("Revenue Report", color="r", size="15pt", bold=True, italic=True)
self.graphWidget.setBackground('w')
labelStyle = {"color": "green", "font-size": "18px"}
labelBrandStyle = {"color": "purple", "font-size": "18px"}
self.graphWidget.setLabel("left","Revenue (VNĐ)",**labelStyle)
self.graphWidget.setLabel("bottom","Cities",**labelStyle)
self.graphWidget.setLabel("right", "tranduythanh.com", **labelBrandStyle)
self.graphWidget.showGrid(x=True, y=True)
self.width = 0.2
self.bargraphItems = []
self.legend = self.graphWidget.addLegend()
self.layoutGraph.addWidget(self.graphWidget)
def setupSignal(self):
self.pushButtonPickDataset.clicked.connect(self.processPickDataset)
self.chkBackgroundGrid.stateChanged.connect(self.processChangeGrid)
self.chkLegend.stateChanged.connect(self.processChangeLegend)
self.pushButtonChangBackground.clicked.connect(self.processChangeChartBackground)
self.pushButtonChangeBarColor.clicked.connect(self.processChangeBarColor)
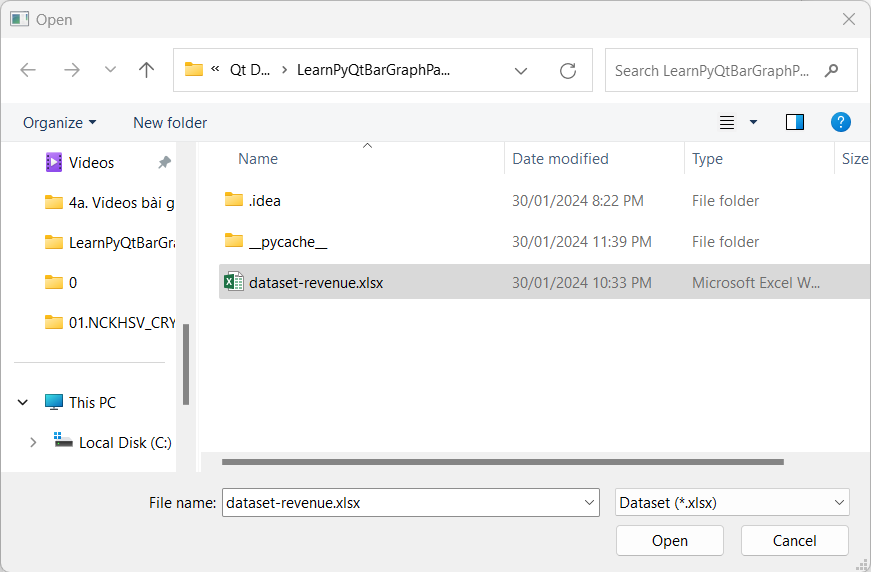
def processPickDataset(self):
filters = "Dataset (*.xlsx);;All files(*)"
filename, selected_filter = QFileDialog.getOpenFileName(
self.MainWindow,
filter=filters,
)
self.lineEditDataset.setText(filename)
self.drawChart(filename)
def drawChart(self,datasetPath):
#read Excel file into DataFrame by Pandas
dataframe = pd.read_excel(datasetPath)
#Read columns, we omit first column (corner)
#Hà Nội,Huế,TP.HCM,Cần Thơ,An Giang:
self.xlab = dataframe.columns.values[1:]
#create an array from 1 to number of column
self.positions = np.arange(1, len(self.xlab) + 1)
#remove existing BarGraph Item
#(user can choose file many times)
for barItem in self.bargraphItems:
self.graphWidget.removeItem(barItem)
self.bargraphItems = []
self.cboBarItem.clear()
i = 0
#loop to read row data
for row in range(len(dataframe.values)):
#Get value in the first column for each row(quarter X)
name = dataframe.values[row][0]
#Get an Array data for each row
revenues = dataframe.values[row][1:].tolist()
#setup the position for each graph bar item
x = self.positions + i * self.width
#random color for each bar item
brush = (nd.randint(0, 255), nd.randint(0, 255), nd.randint(0, 255))
#create BarGraphItem:
bargraphItem = CustomBarGraphItem(x=x, height=revenues, width=self.width, brush=brush, name=name)
i = i + 1
#store bargraphItem into bargraphItems
self.bargraphItems.append(bargraphItem)
#add the Bar Graph Item into the Chart
self.graphWidget.addItem(bargraphItem)
#Draw the name of BarItem into QComBoBox
self.cboBarItem.addItem(bargraphItem.name(), bargraphItem)
#setup tick
self.autoTick(self.graphWidget, self.xlab)
#setup label
self.autolabel(self.bargraphItems)
def processChangeGrid(self,value):
state=Qt.CheckState(value)
if state==Qt.CheckState.Checked:
self.graphWidget.showGrid(x=True, y=True)
else:
self.graphWidget.showGrid(x=False, y=False)
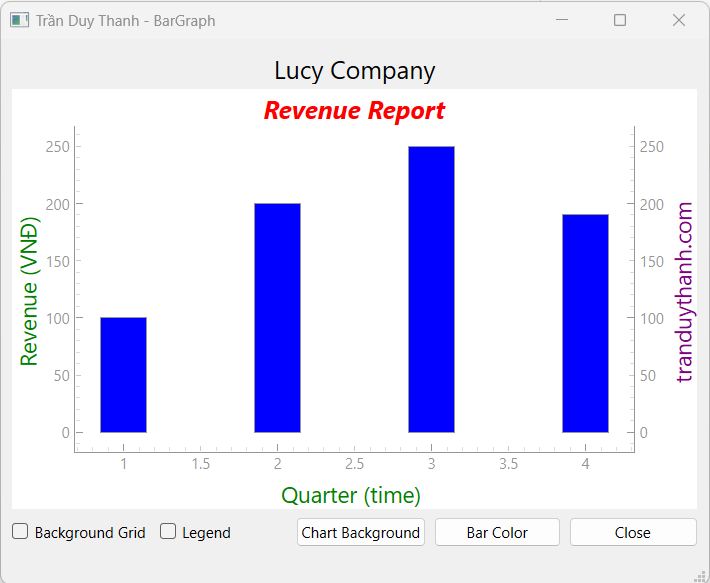
def processChangeLegend(self,value):
state=Qt.CheckState(value)
if state==Qt.CheckState.Checked:
self.legend.show()
else:
self.legend.hide()
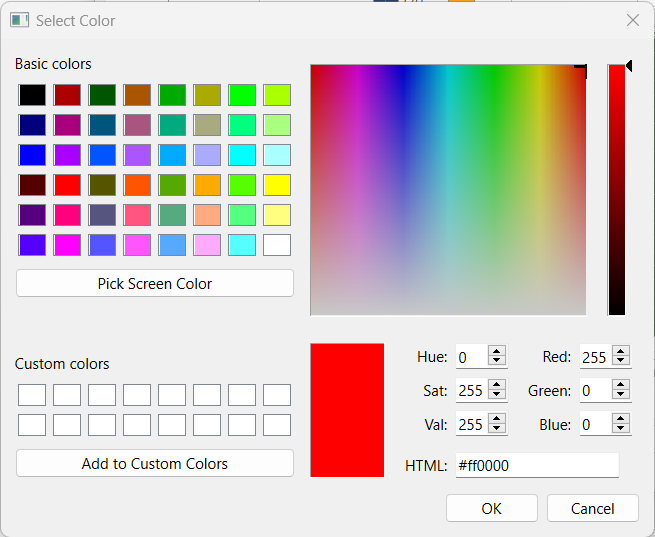
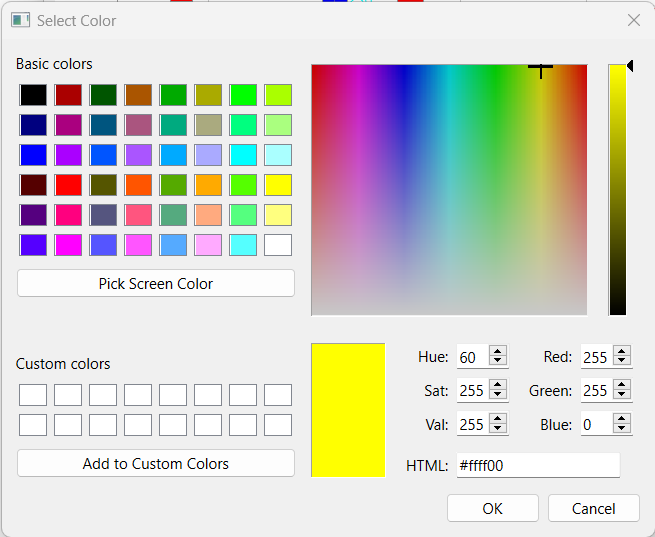
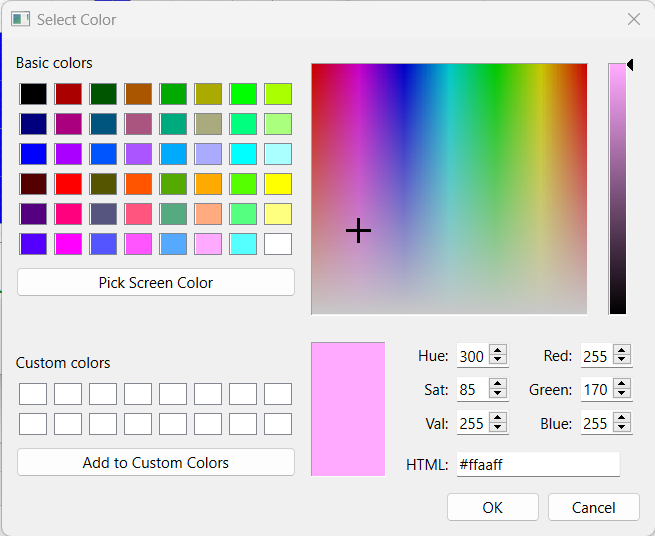
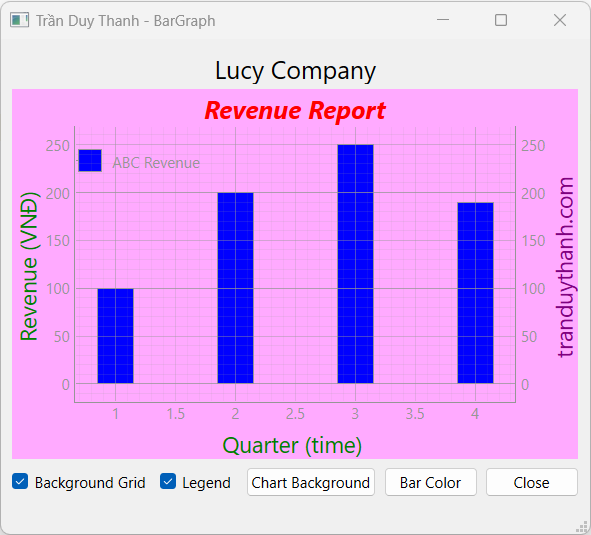
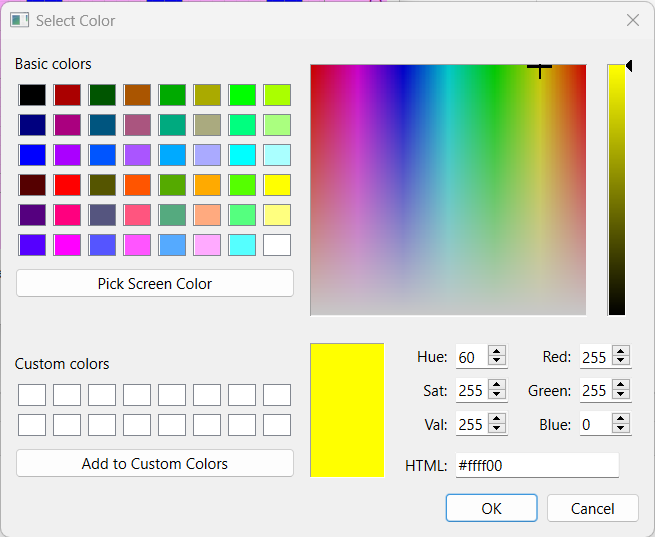
def processChangeChartBackground(self):
dialog = QColorDialog()
if dialog.exec():
color = dialog.currentColor()
self.graphWidget.setBackground(color.name())
del dialog
def processChangeBarColor(self):
dialog = QColorDialog()
if dialog.exec():
color = dialog.currentColor()
bargraphItem=self.bargraphItems[self.cboBarItem.currentIndex()]
bargraphItem.opts["brush"]=color.name()
bargraphItem._updateColors(bargraphItem.opts)
del dialog
def autoTick(self,graphWidget, xlab):
ticks = []
for i, item in enumerate(xlab):
ticks.append((i +1+ 2*self.width, item))
ticks = [ticks]
ax = graphWidget.getAxis('bottom')
ax.setTicks(ticks)
def autolabel(self,barItems):
# attach some text labels
for barItem in barItems:
xs, heights = barItem.getData()
for i in range(len(heights)):
height = heights[i]
x = xs[i]
clr = barItem.opts["brush"]
text = pg.TextItem(str(height), color=clr)
text.setParentItem(barItem)
text.setX(x)
text.setY(height)
text.setAnchor((QPointF(0.5, 0.75)))
def show(self):
self.MainWindow.show()Chúng ta quan sát dòng lệnh 83 thôi, đây là chỗ thay thế pg.BarGraphItem bằng:
bargraphItem = CustomBarGraphItem(x=x, height=revenues, width=self.width, brush=brush, name=name).
Bước 6: Viết mã lệnh “MyApp.py” để thực thi chương trình:
from PyQt6.QtWidgets import QApplication, QMainWindow
from MainWindowEx import MainWindowEx
app=QApplication([])
myWindow=MainWindowEx()
myWindow.setupUi(QMainWindow())
myWindow.show()
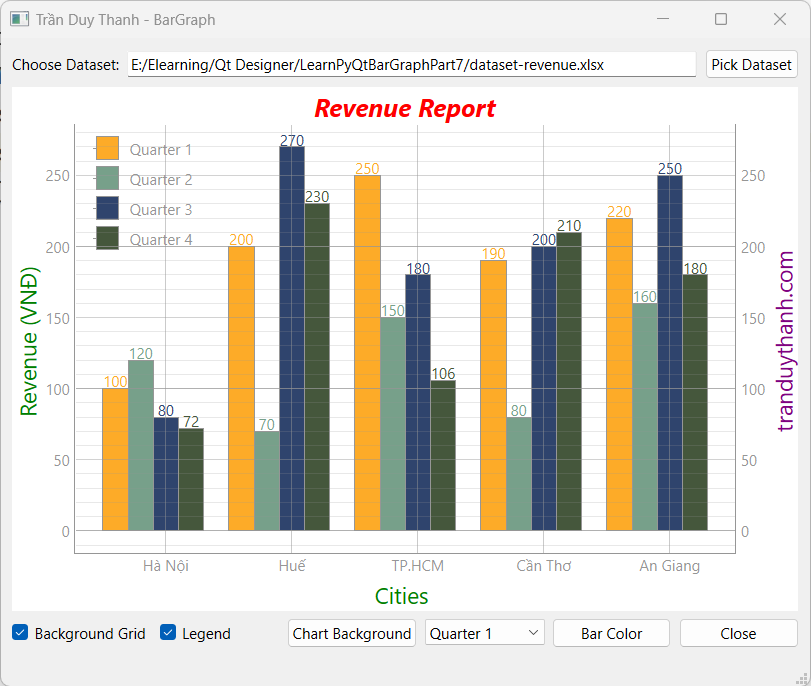
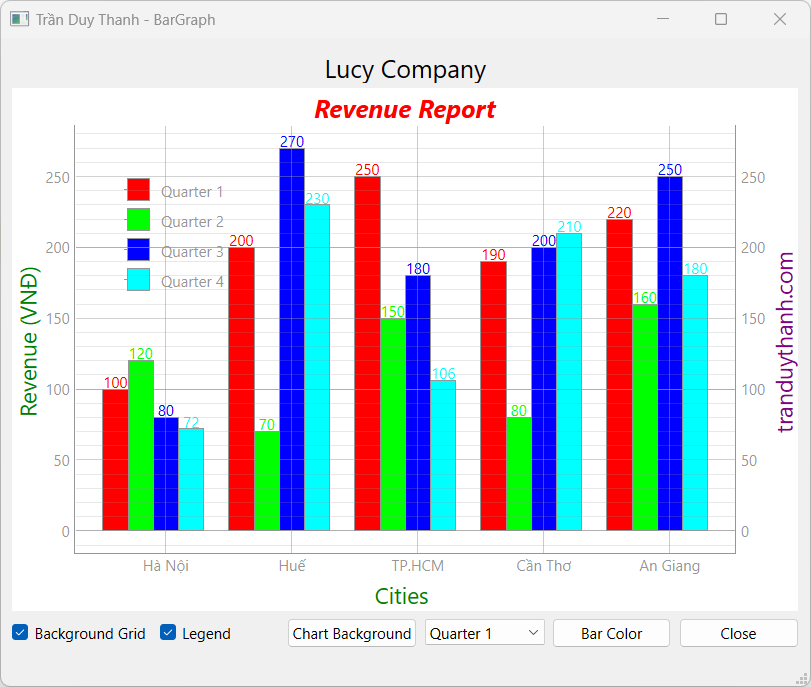
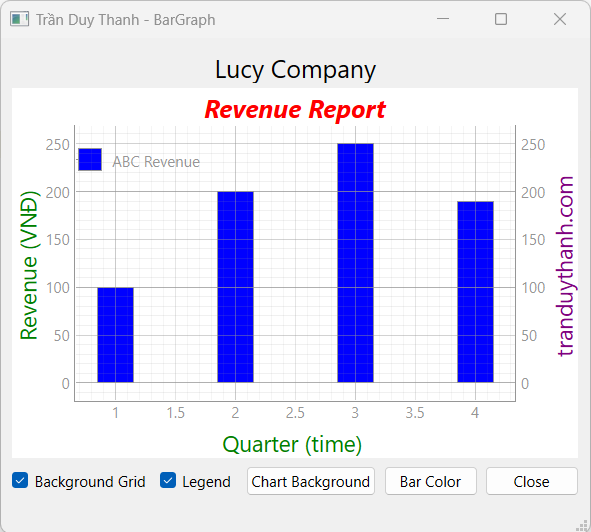
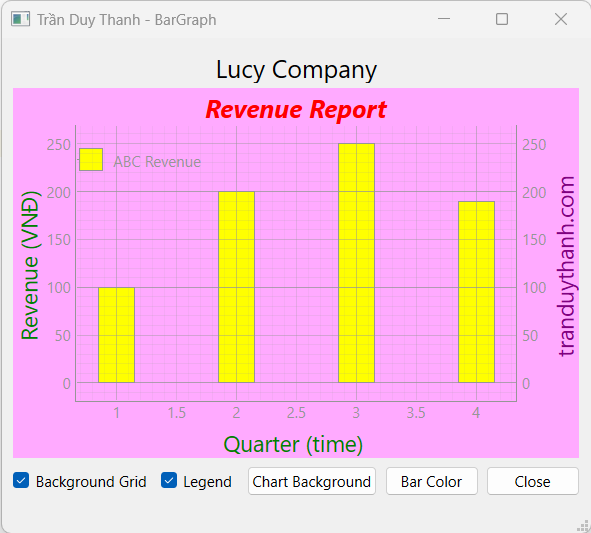
app.exec()Thực thi MyApp.py ta có kết quả, Chạy phần mềm lên:
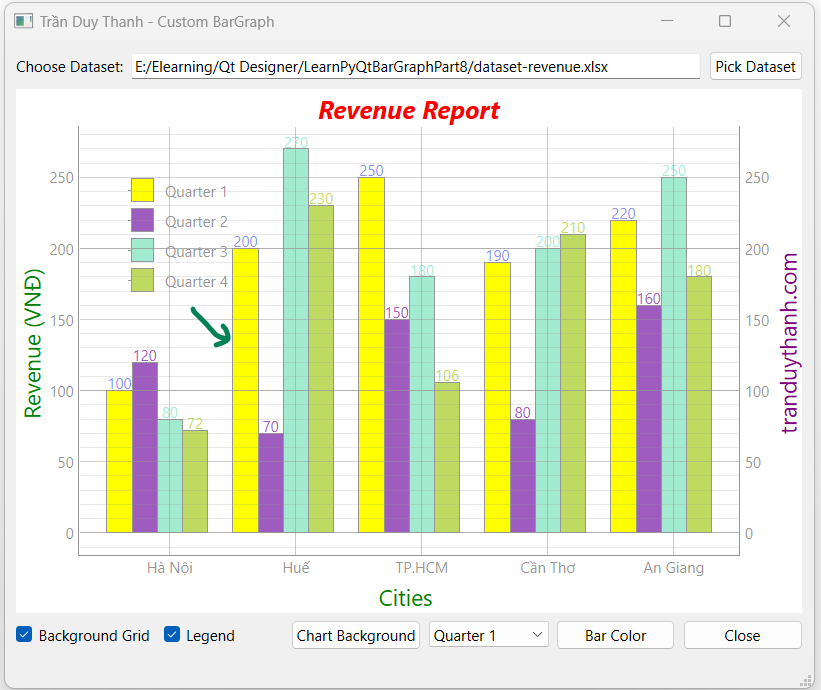
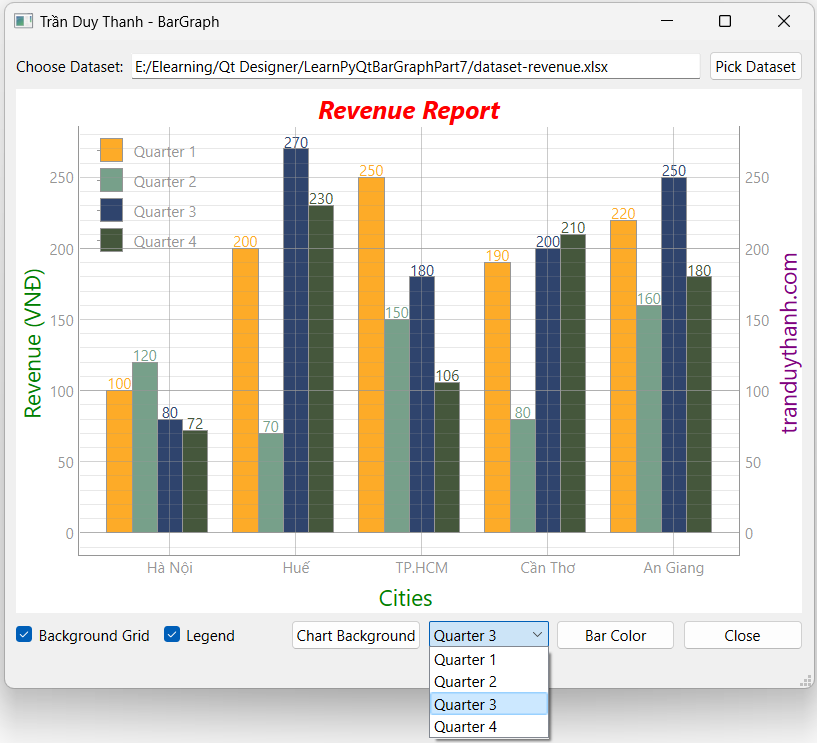
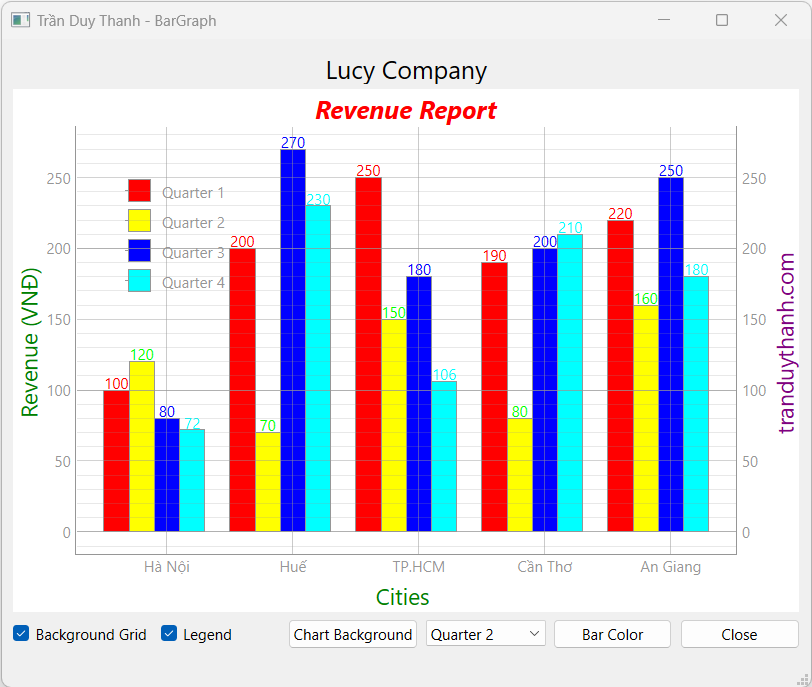
Khi nhấn BarItem nào thì nó tự động đổi qua nền vàng, bấm qua BarItem khác thì nó phục hồi lại màu như cũ.
Như vậy chúng ta đã làm xong CustomGraphBarItem, các bạn đã biết cách xử lý sự kiện riêng cho từng bar item, có thể áp dụng vào nhiều mục đích khác nhau.
Soure code của bài này các bạn tải ở đây:
https://www.mediafire.com/file/kdvzf1melwq37ty/LearnPyQtBarGraphPart8.rar/file
Bài học sau Tui sẽ hướng dẫn các bạn cách lập trình Đa tiến trình để giúp cập nhật giao diện thời gian thực được mượt mà.
Chúc các bạn thành công