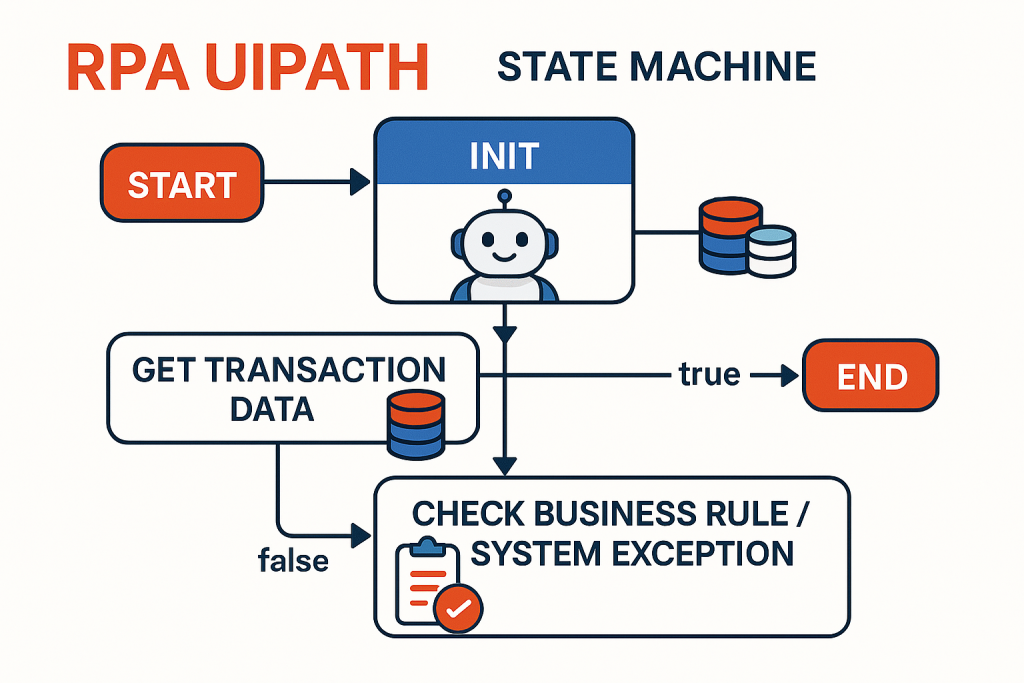
Máy trạng thái (State Machine) là một dạng tự động hóa hoạt động dựa trên một số trạng thái hữu hạn. Hệ thống sẽ chuyển vào một trạng thái khi có một hoạt động kích hoạt, và thoát khỏi trạng thái đó khi có hoạt động khác xảy ra.
Một phần quan trọng trong máy trạng thái là các chuyển tiếp (transitions) – chúng cho phép Ta thiết lập điều kiện để chuyển từ trạng thái này sang trạng thái khác. Các chuyển tiếp này thường được thể hiện bằng các mũi tên hoặc nhánh nối giữa các trạng thái.
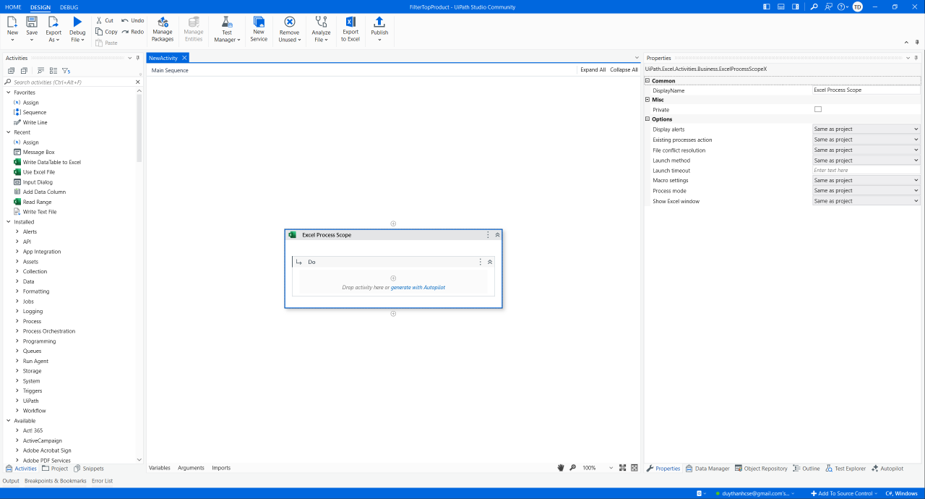
Trong phần Workflow > State Machine, có hai hoạt động đặc trưng của máy trạng thái là: State (Trạng thái) và Final State (Trạng thái kết thúc).
State (Trạng thái) Activity gồm ba phần: Entry (Khi vào trạng thái), Exit (Khi thoát trạng thái) và Transition(s) (Các chuyển tiếp):
Trong khi đó, Final State (Trạng thái kết thúc) Activity chỉ có Entry:
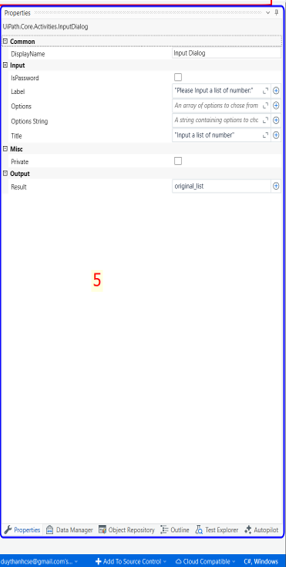
Cả hai loại Activity (State và Final State) này đều có thể được mở rộng bằng cách nhấp đúp chuột, cho phép Ta xem chi tiết và chỉnh sửa nội dung bên trong.
Phần Entry và Exit cho phép Ta thêm các hành động sẽ được thực hiện khi vào hoặc thoát khỏi trạng thái tương ứng. Phần Transition(s) sẽ hiển thị tất cả các chuyển tiếp có liên kết với trạng thái đang được chọn.
Các Transition(chuyển tiếp) sẽ được mở rộng khi bạn nhấp đúp vào chúng, giống như hoạt động State. Chúng bao gồm ba phần: Trigger (Trình kích hoạt), Condition (Điều kiện) và Action (Hành động), cho phép Ta thêm trình kích hoạt cho trạng thái tiếp theo hoặc thêm điều kiện để một Activity hoặc chuỗi Activity được thực thi.
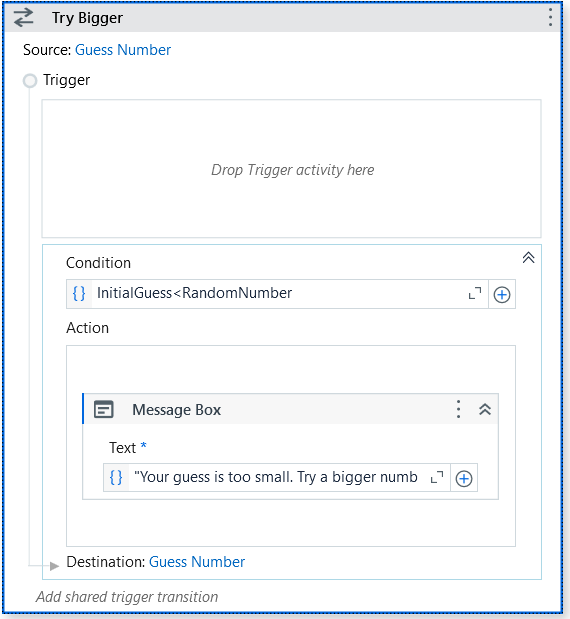
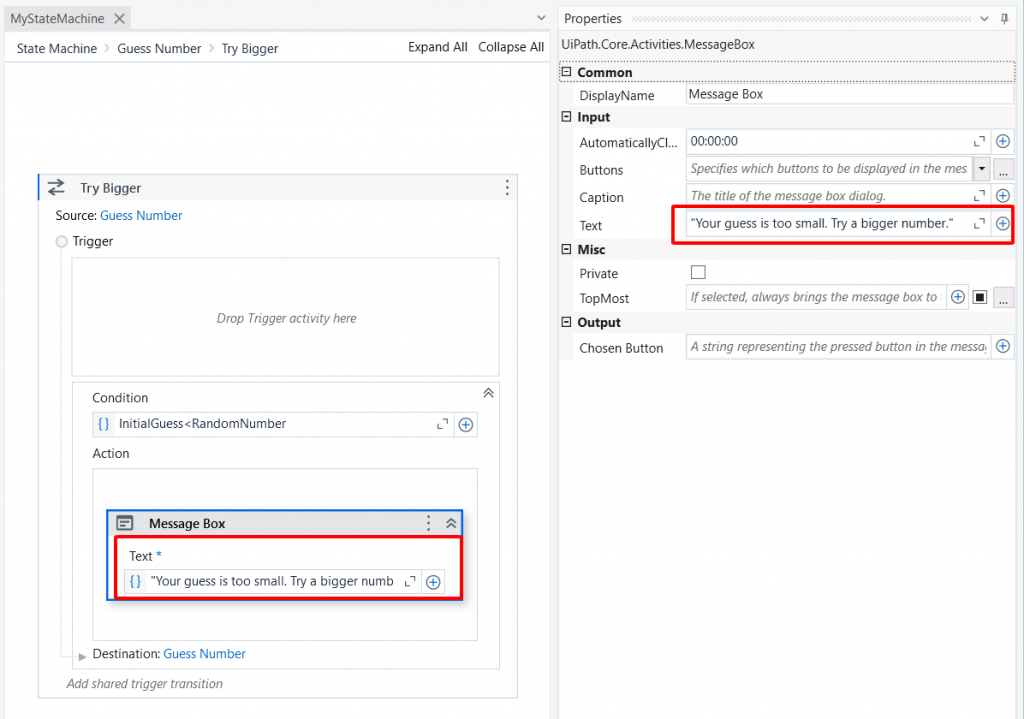
Ví dụ màn hình Transition cho Try Bigger:
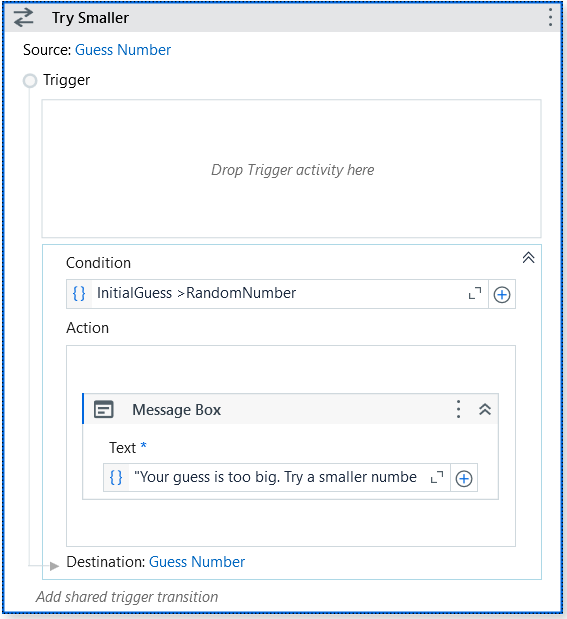
Ví dụ màn hình Transition cho Try Smaller:
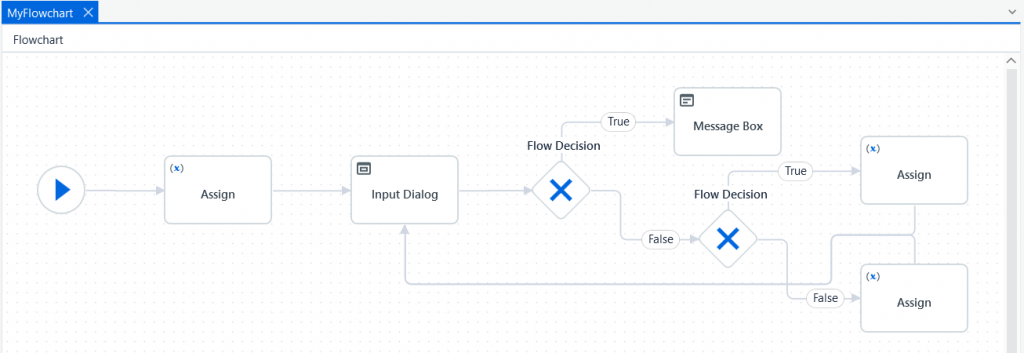
Ta thực hiện bài GAME ĐOÁN SỐ NHỊ PHÂN như bài 25, nhưng sử dụng State Machine.
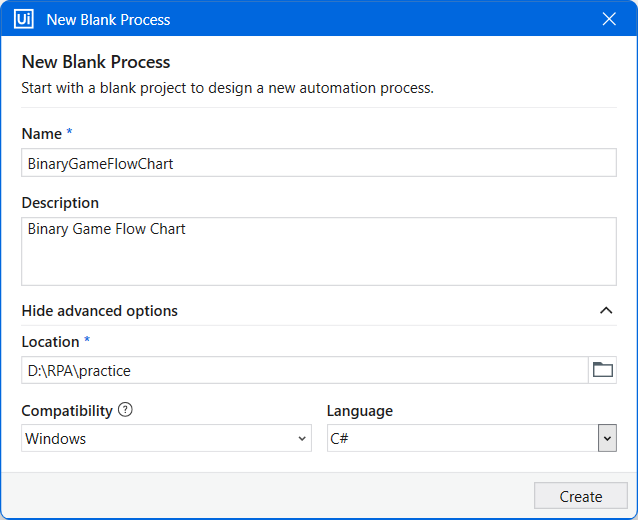
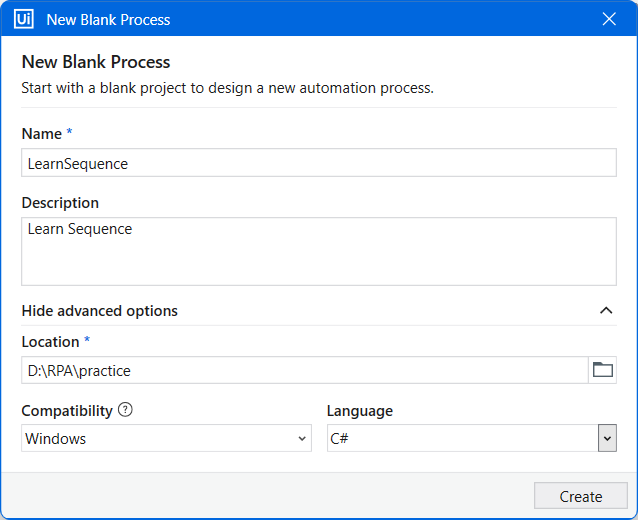
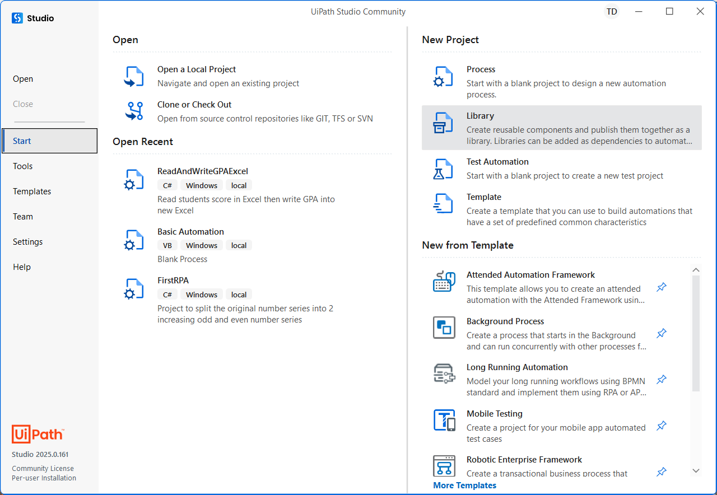
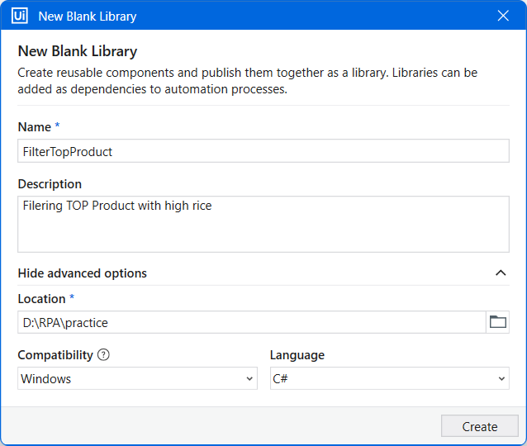
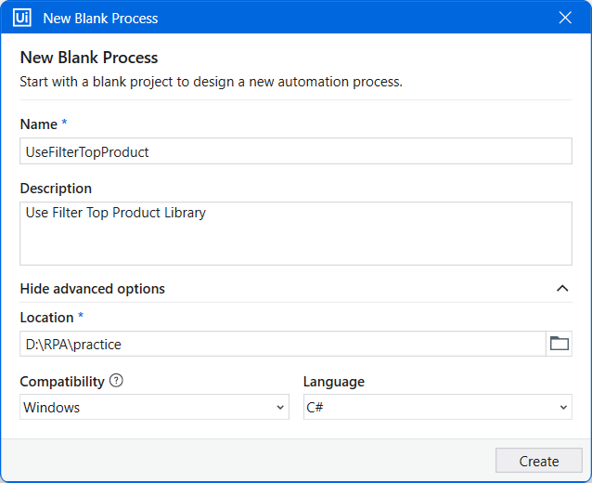
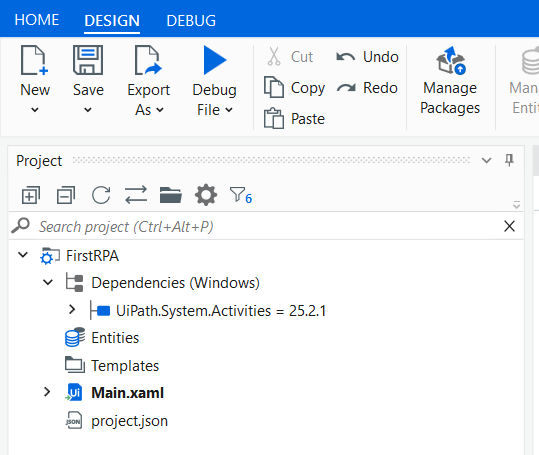
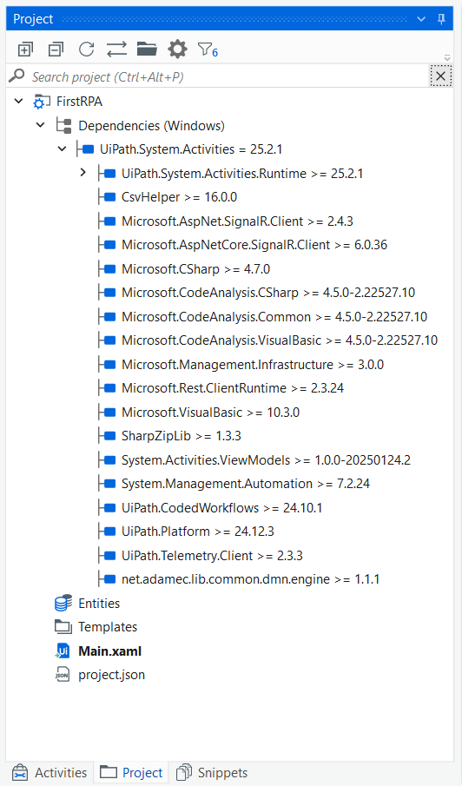
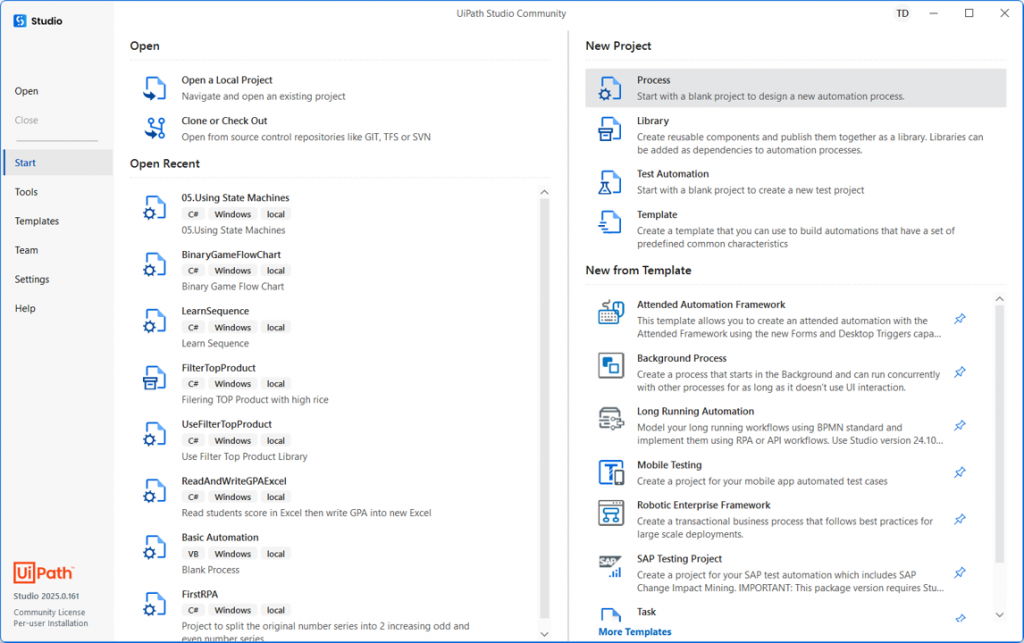
Bước 1: Tạo dự án “LearnStateMachine
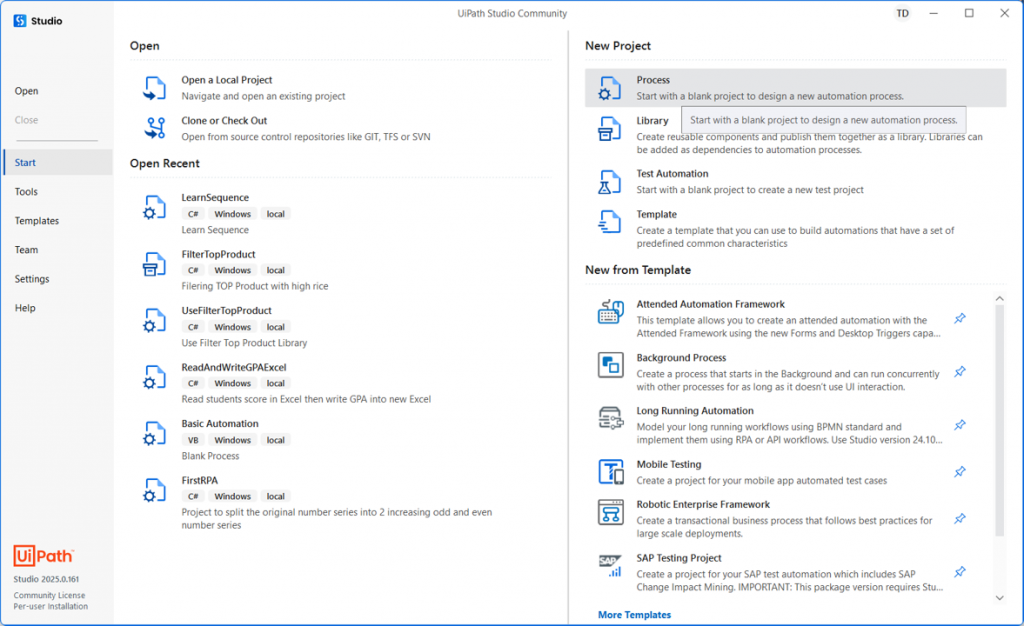
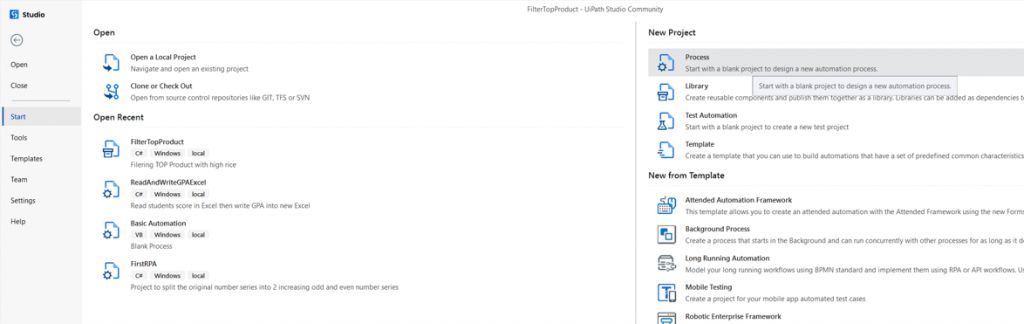
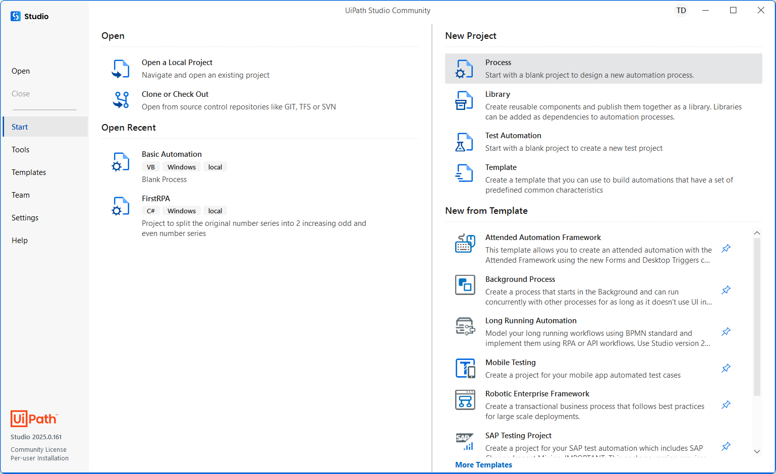
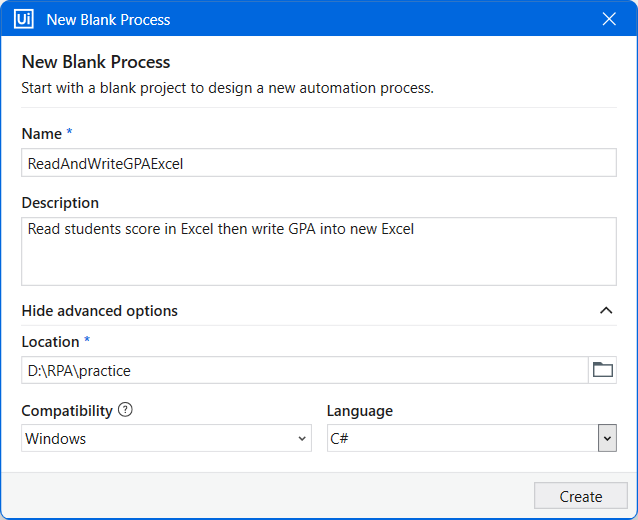
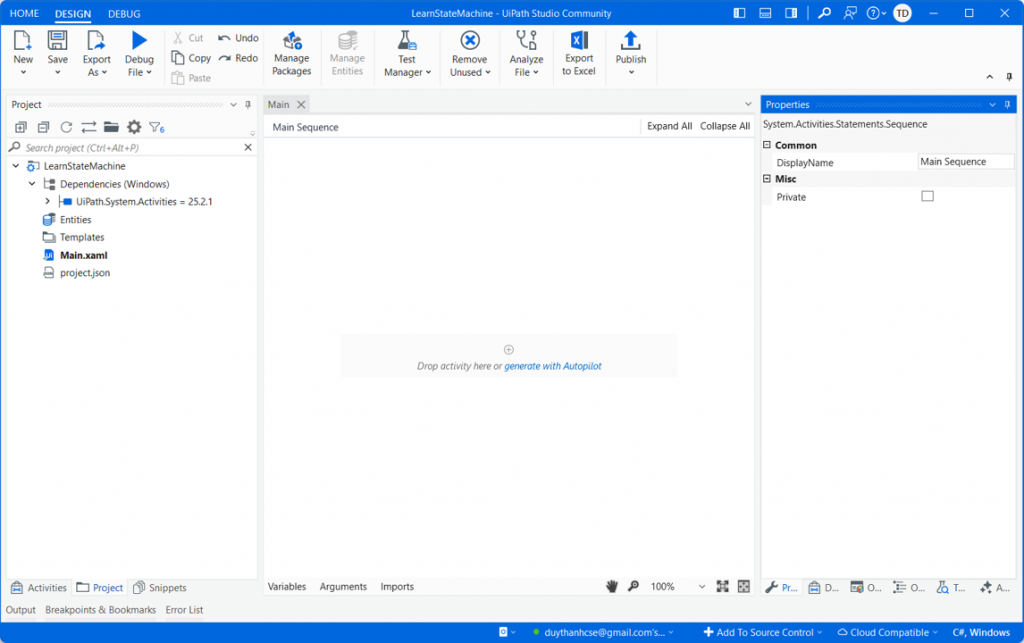
Khởi động UiPath và chọn Process để tạo dự án:
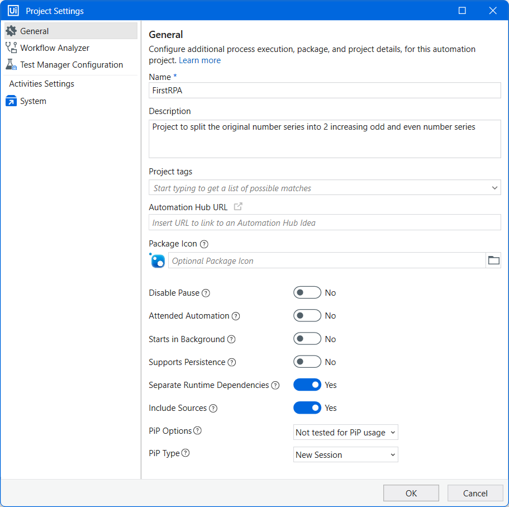
Cấu hình, đặt tên, nơi lưu trữ dự án, ngôn ngữ lập trình:
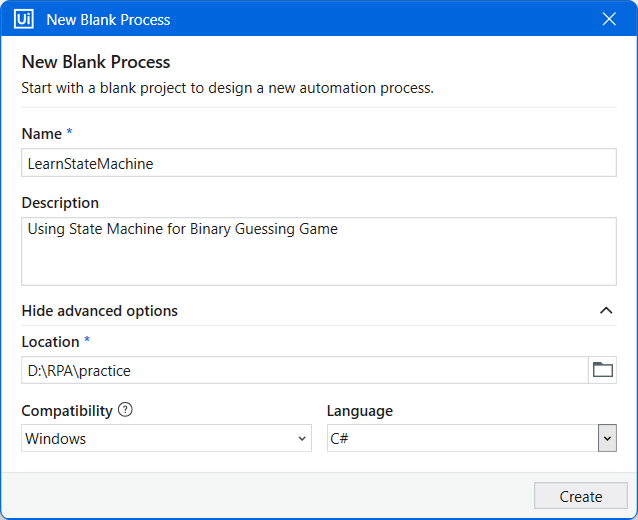
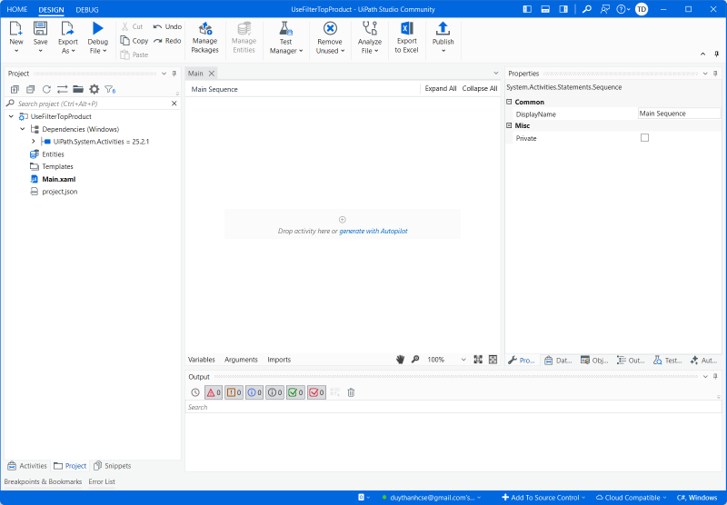
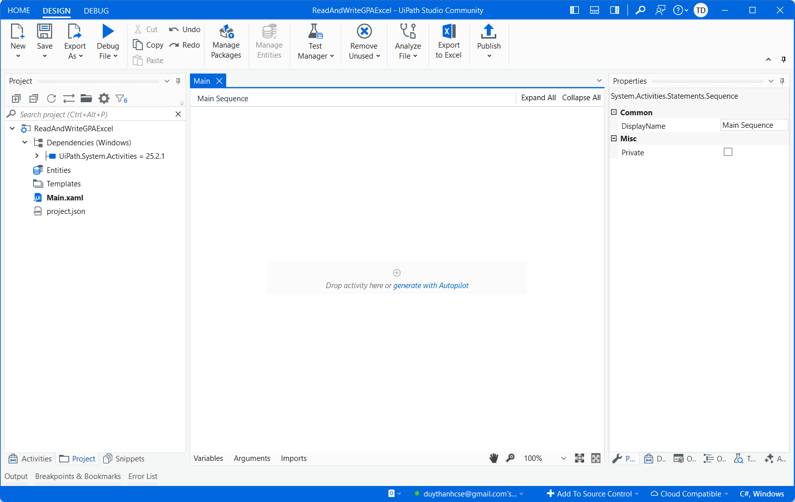
Sau đó bấm Create để tạo dự án.
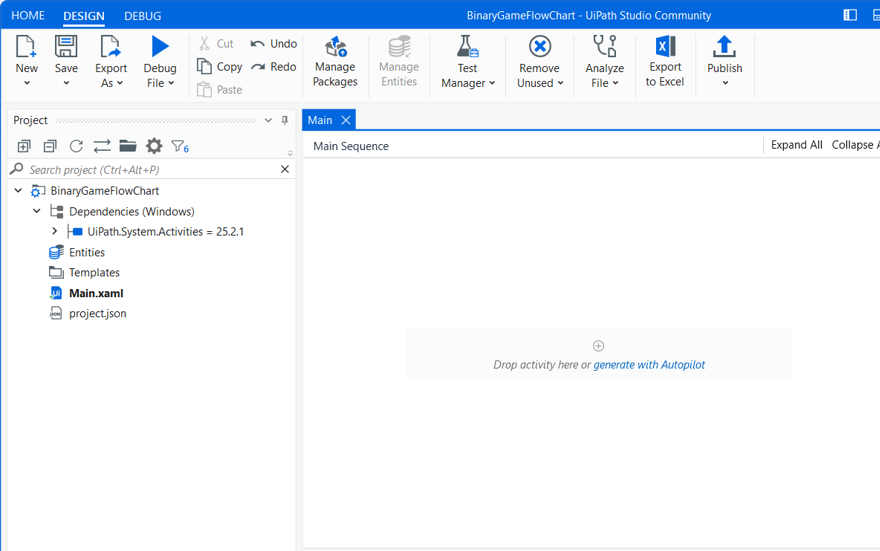
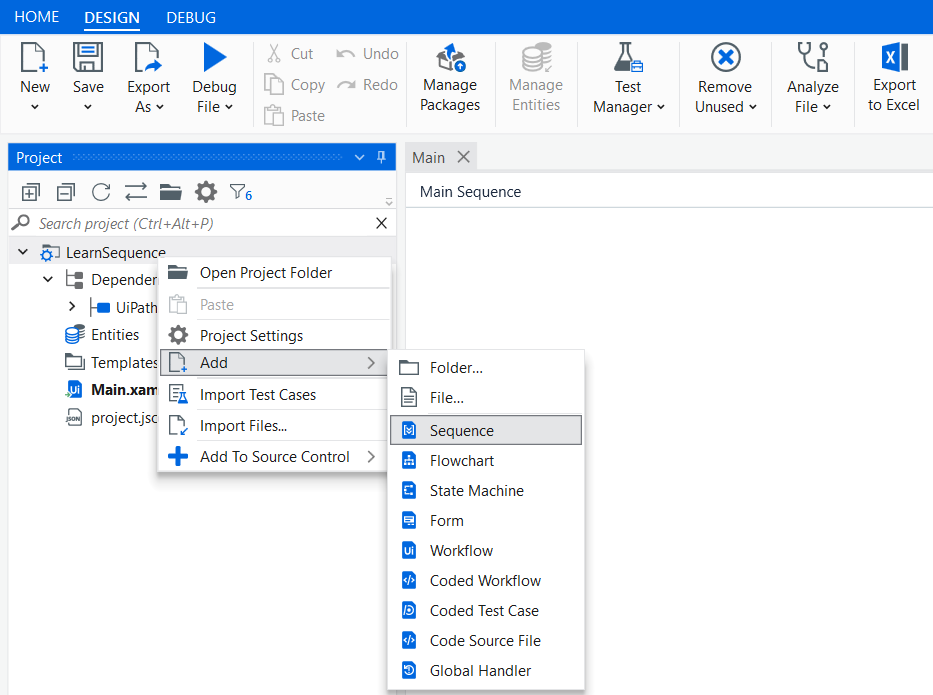
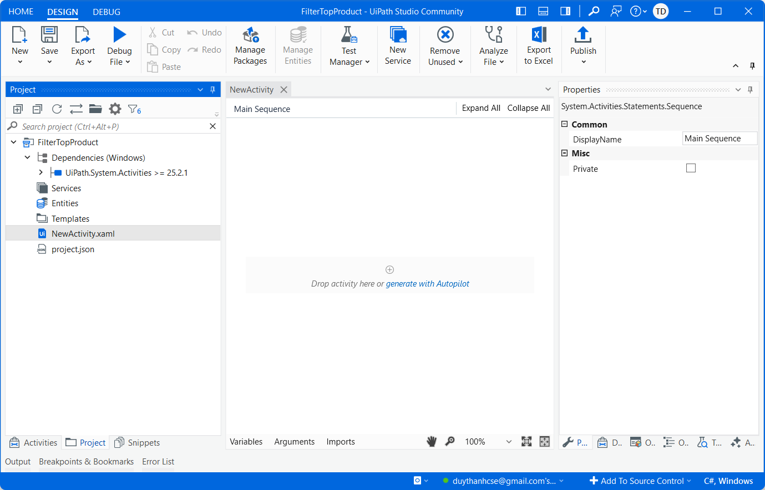
Bước 2: Tạo State Machine
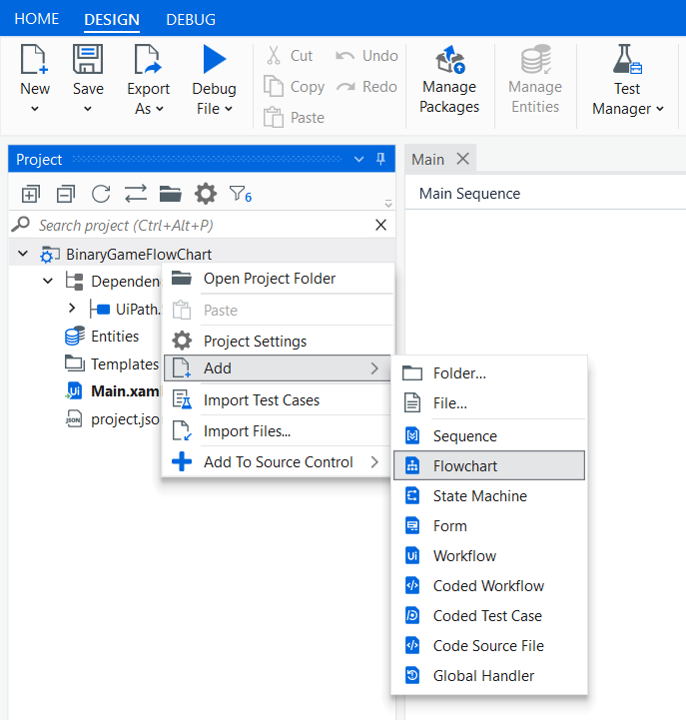
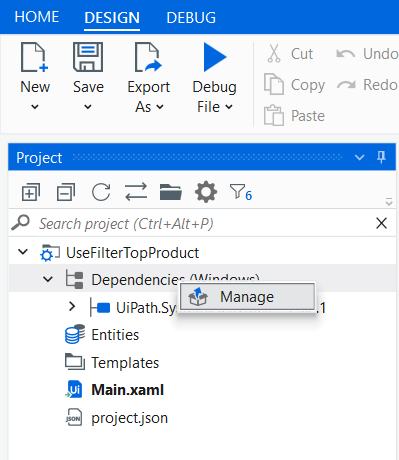
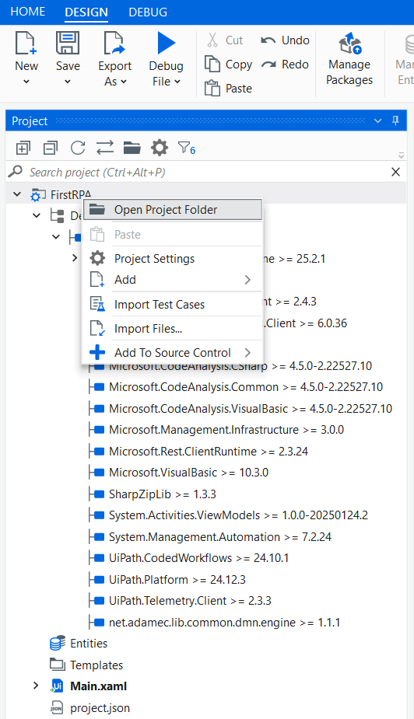
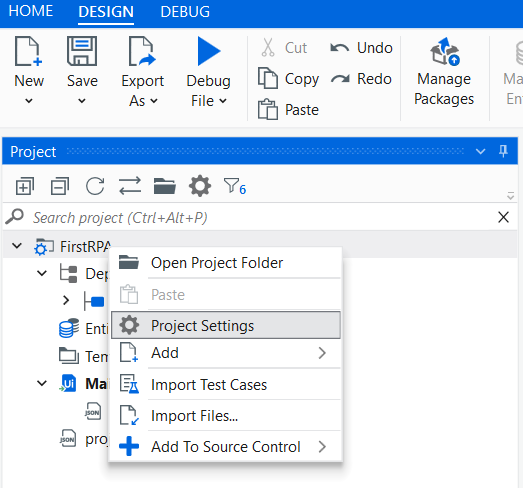
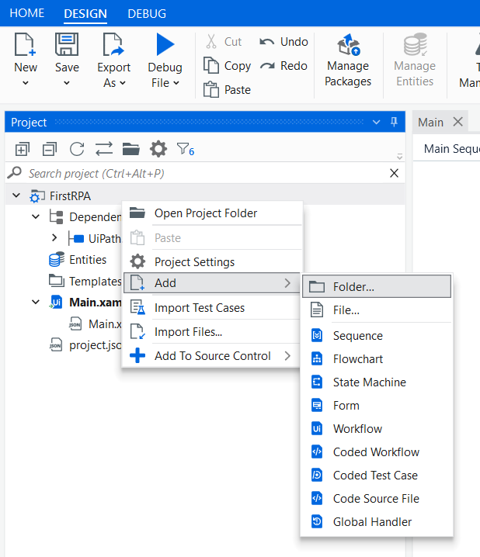
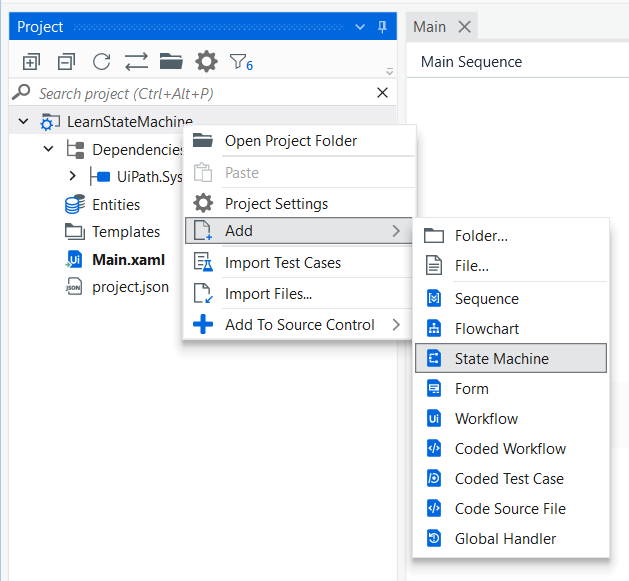
Để tạo State Machine, ta bấm chuột phải vào dự án/ chọn Add/ rồi chọn State Machine:
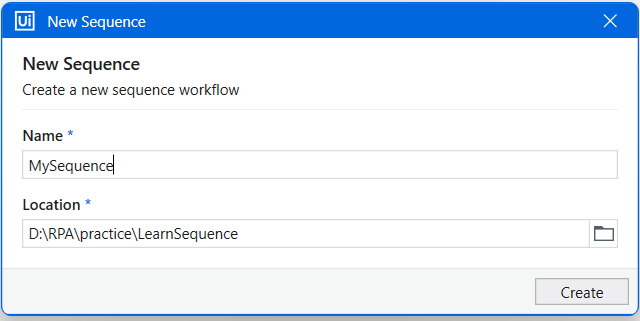
Khi chọn State Machine, màn hình New State Machine xuất hiện như dưới đây:
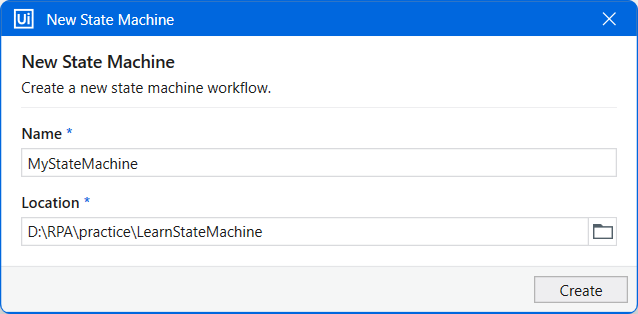
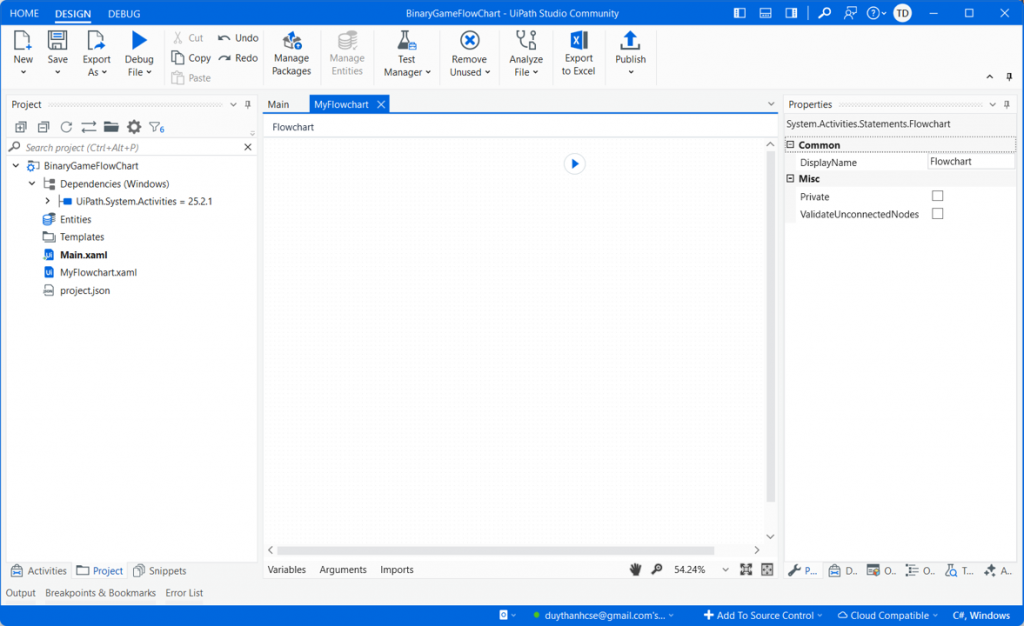
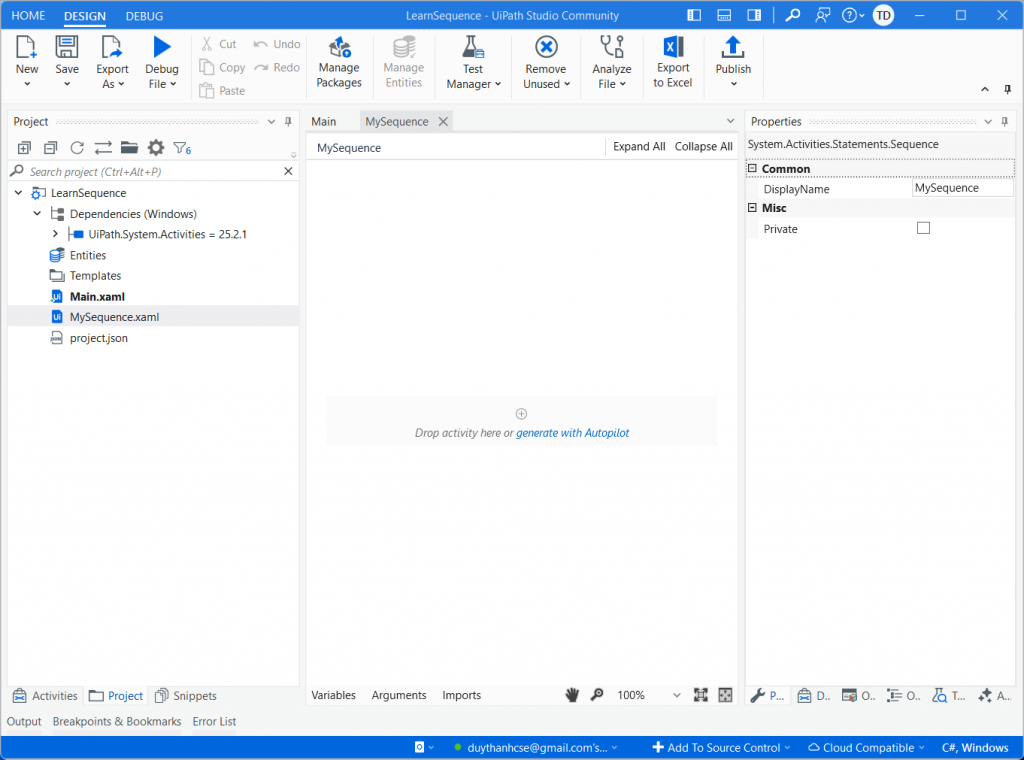
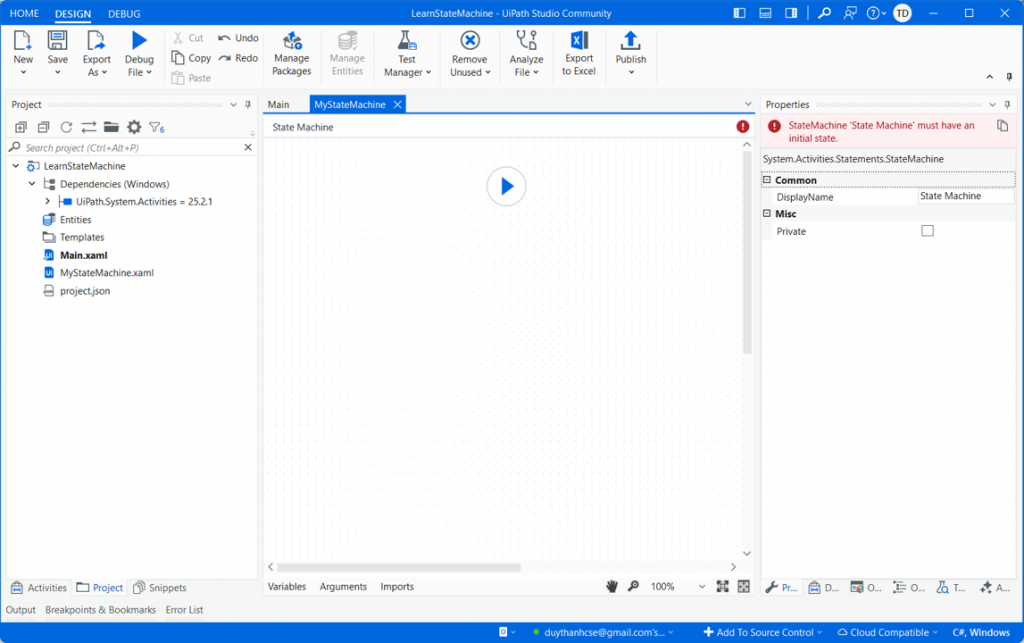
Đặt tên State Machine là “MyStateMachine” rồi nhấn nút Create, kết quả:
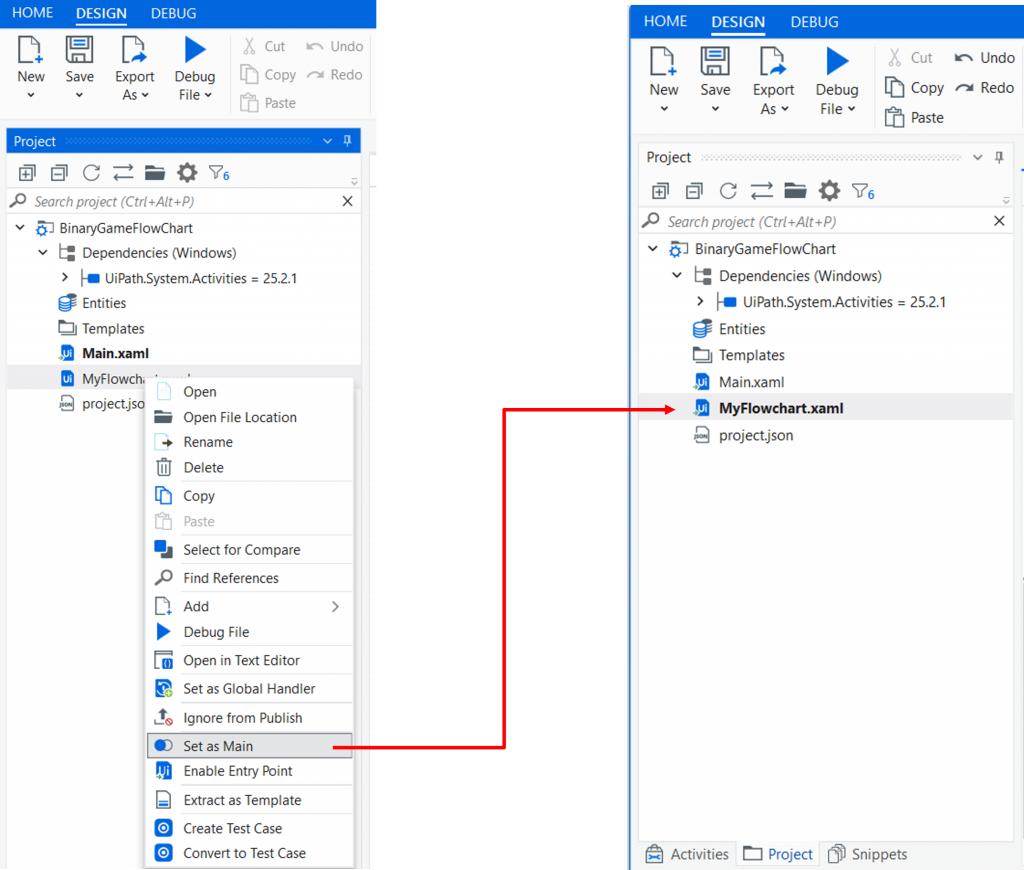
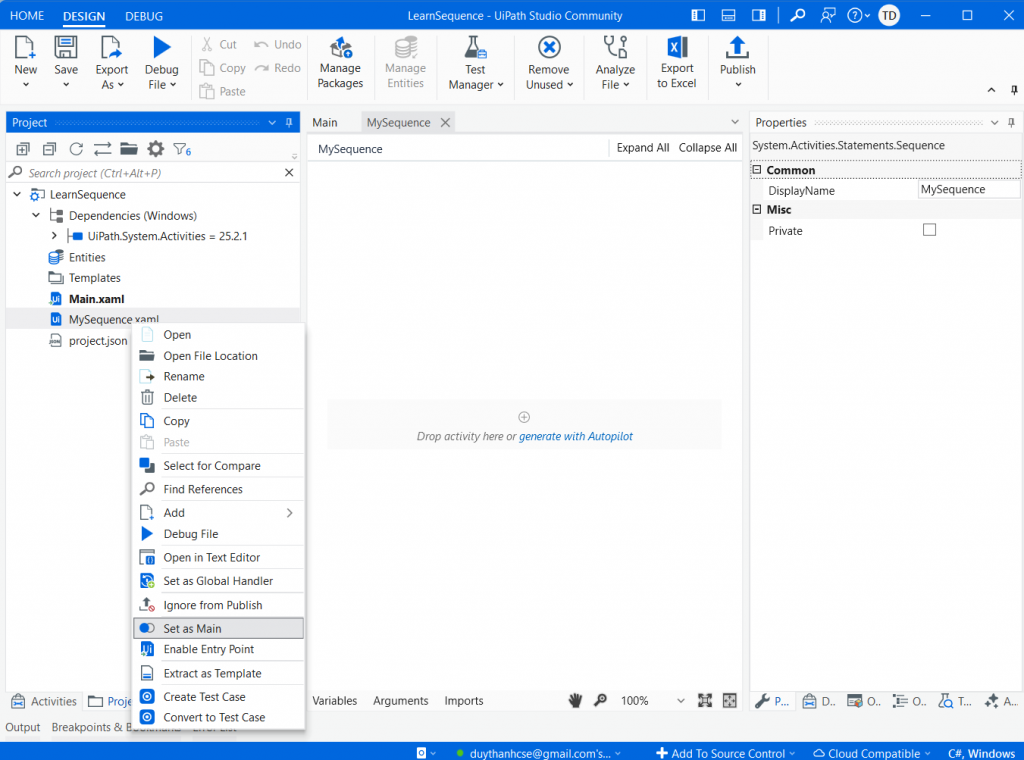
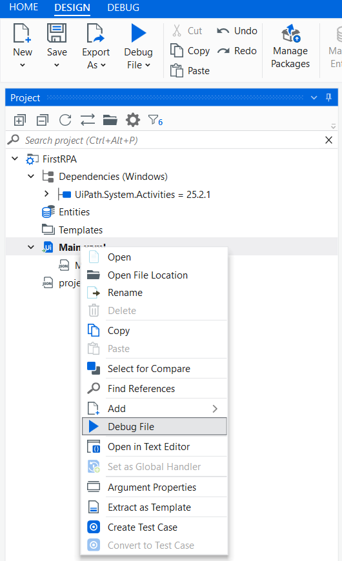
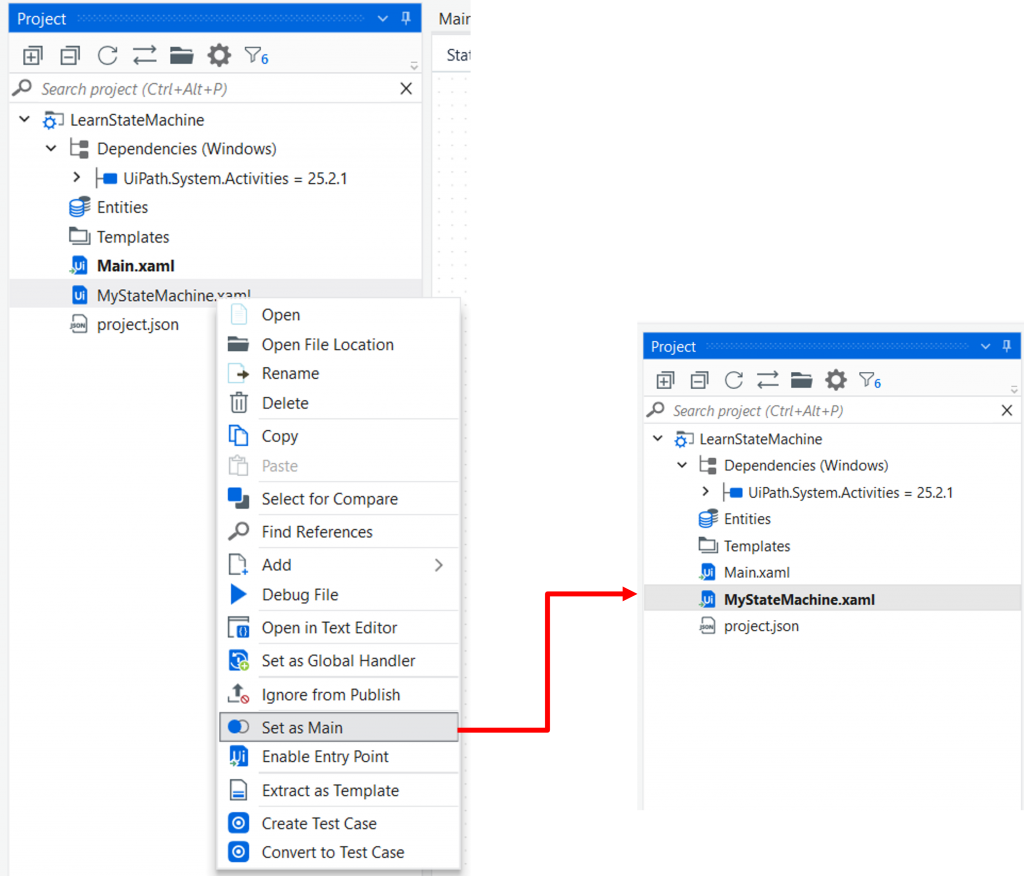
Ta thiết lập để cho “MyStateMachine” chạy mặc định, bằng cách bấm chuột phải vào “MyStateMachine.xaml” rồi chọn “Set as Main”, kết quả:
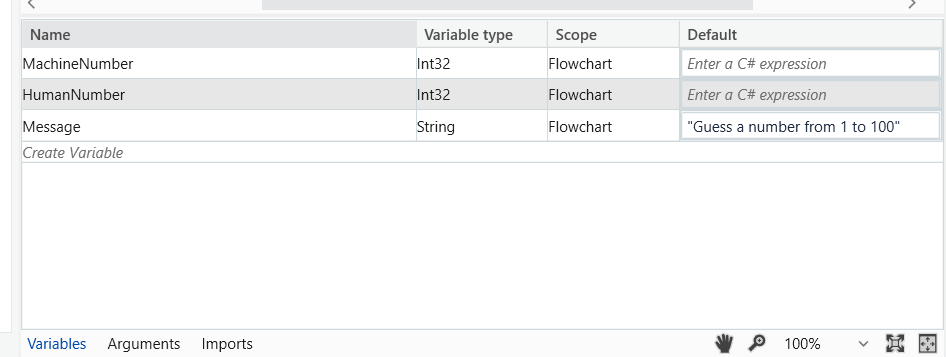
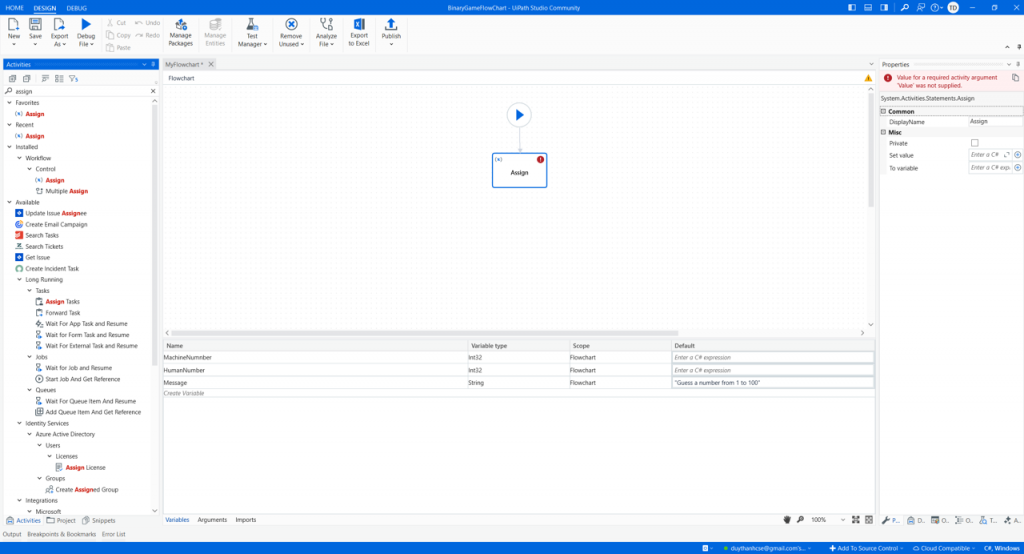
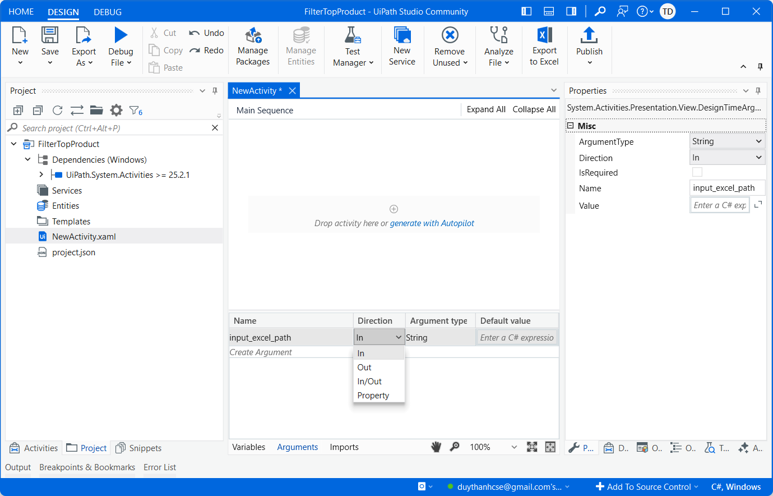
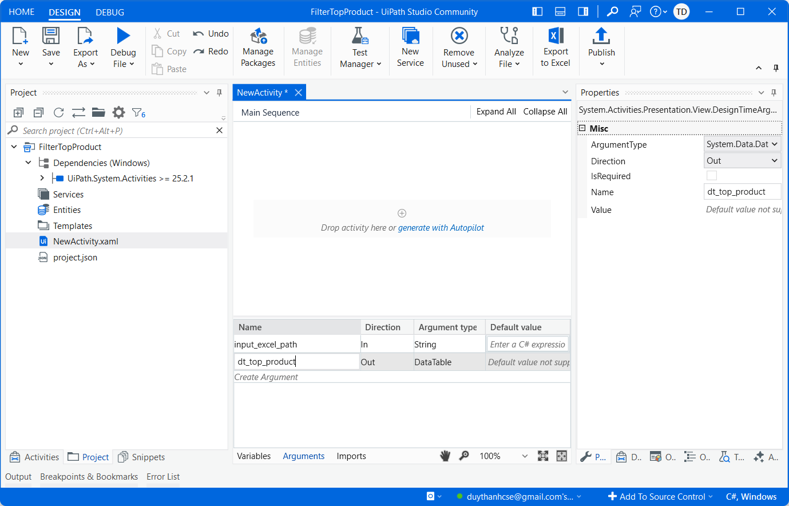
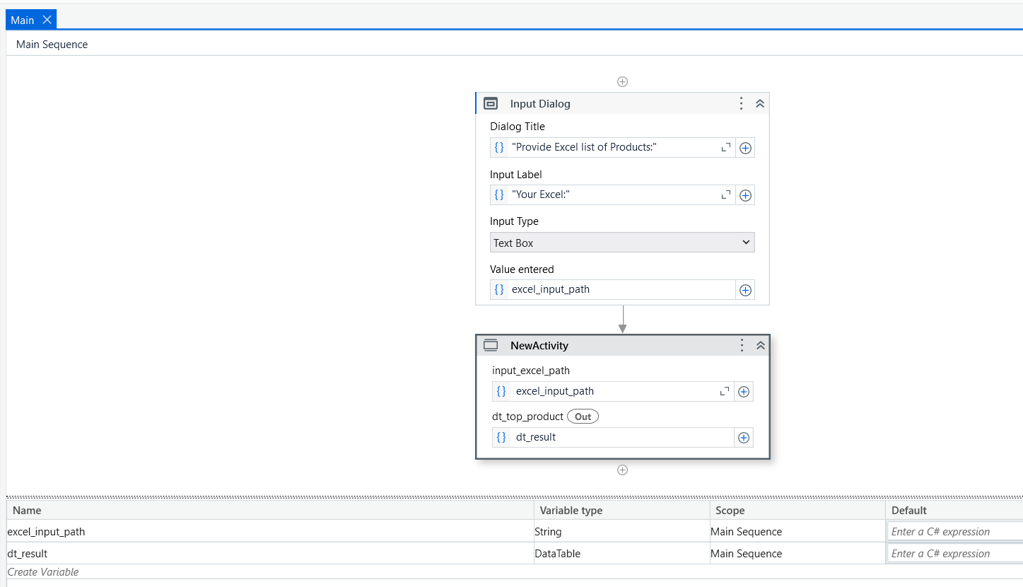
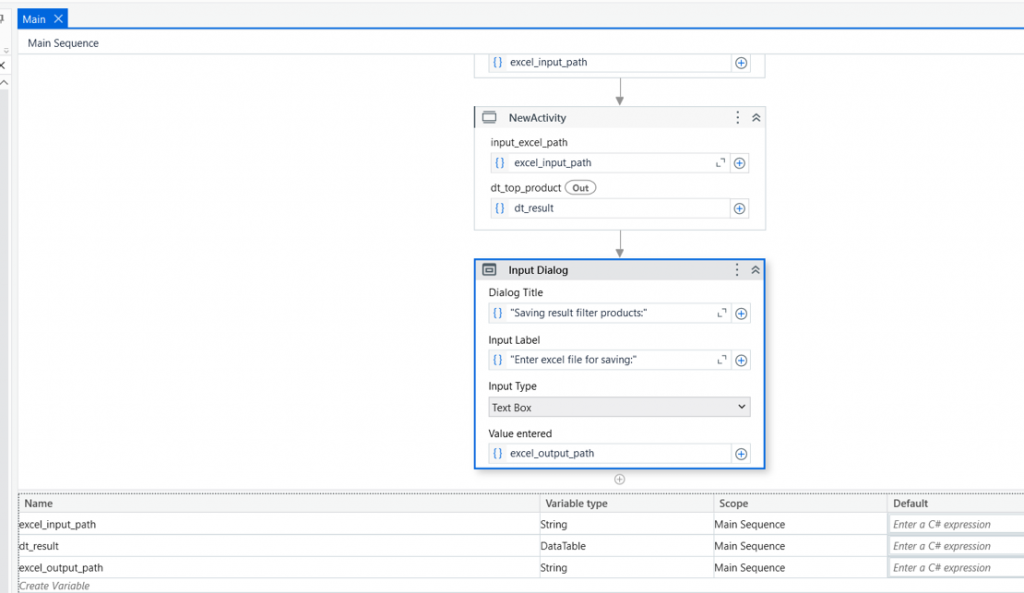
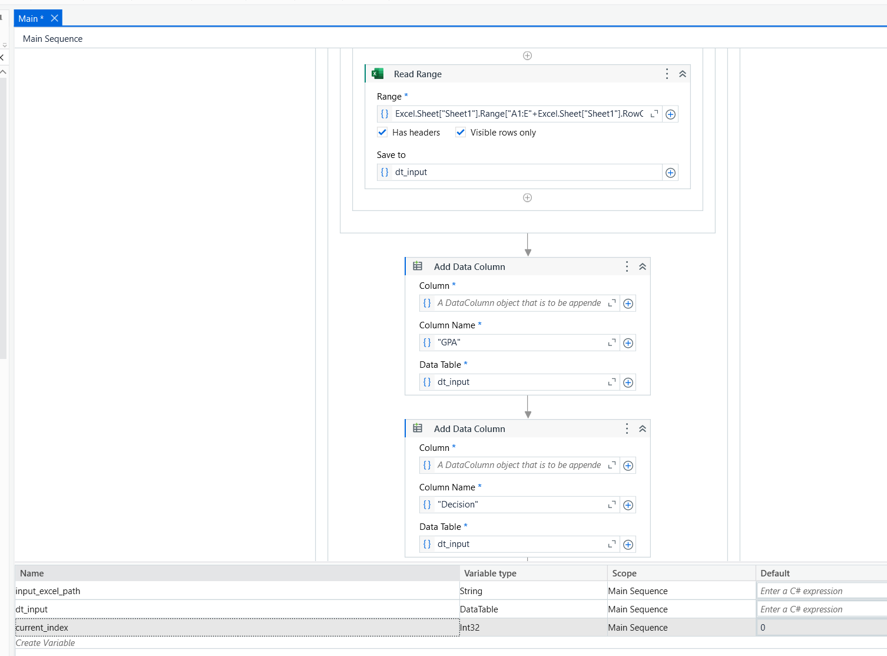
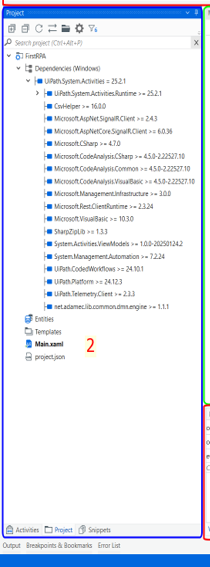
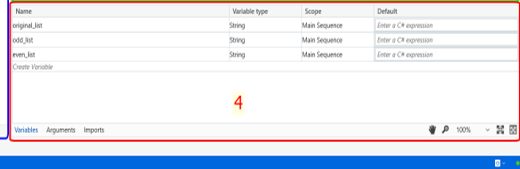
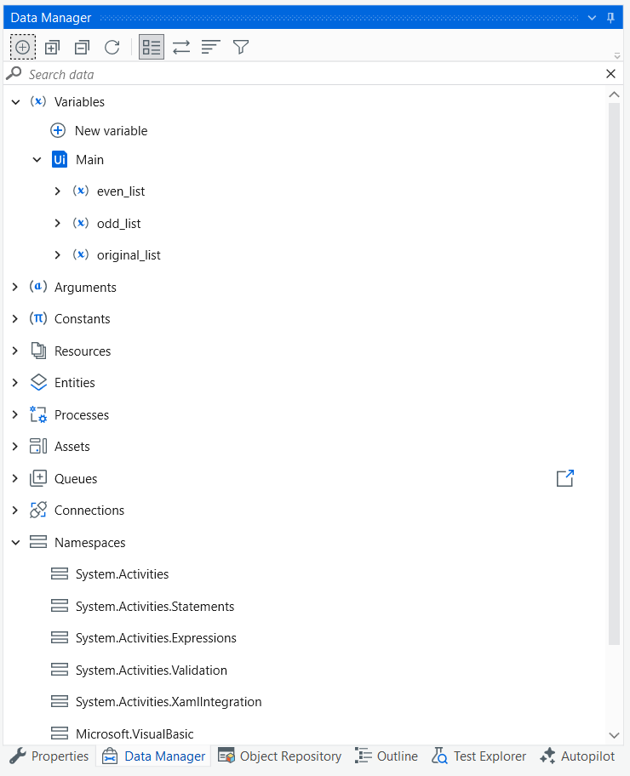
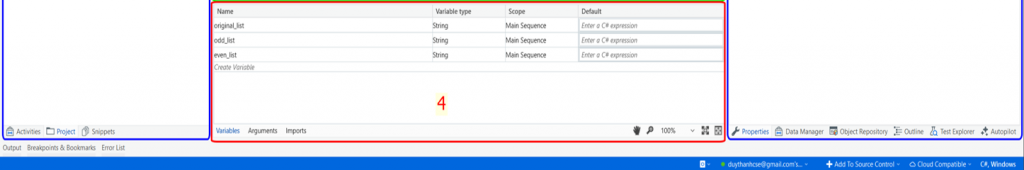
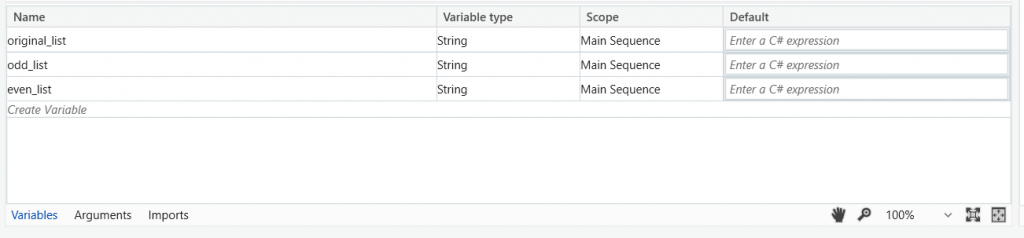
Bước 3: Tạo 2 biến RandomNumber and InitialGuess để lưu trữ số của máy ra ngẫu nhiên và số của người chơi đoán.
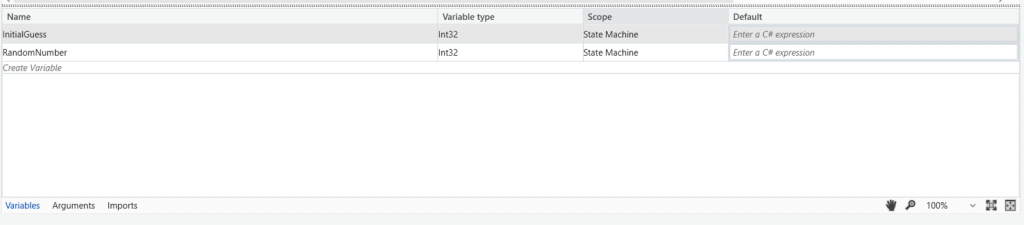
Bạn vào thẻ “Variables” lần lượt tạo 2 biến RandomNumber và InitialGuess có kiểu Int32 như hình Tui chụp minh họa ở trên.
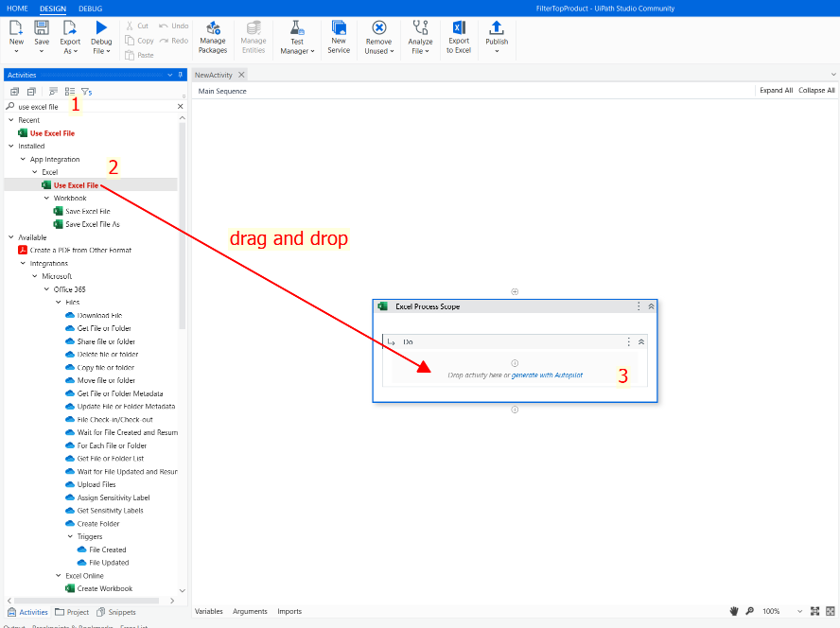
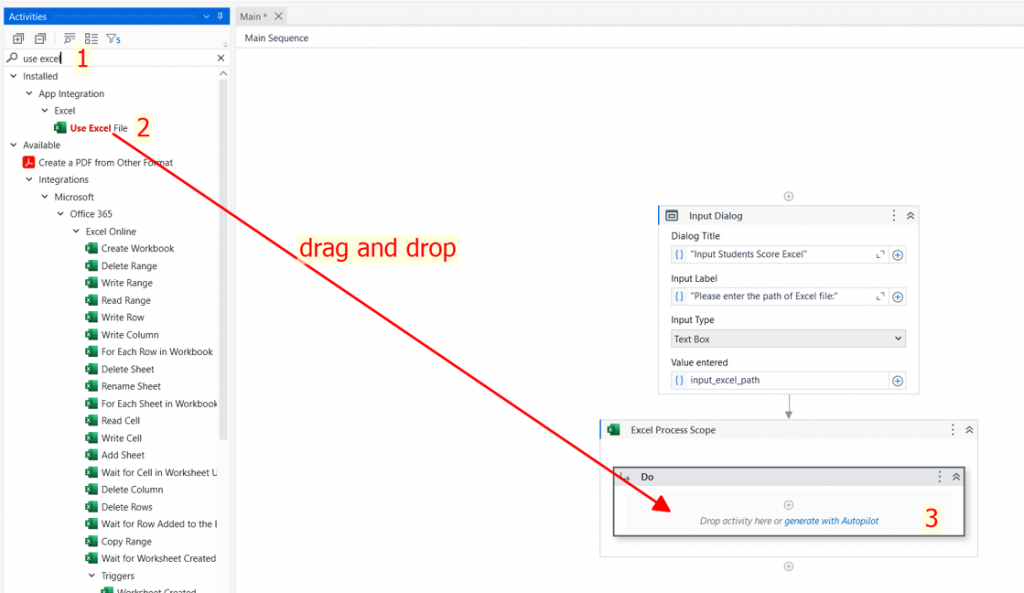
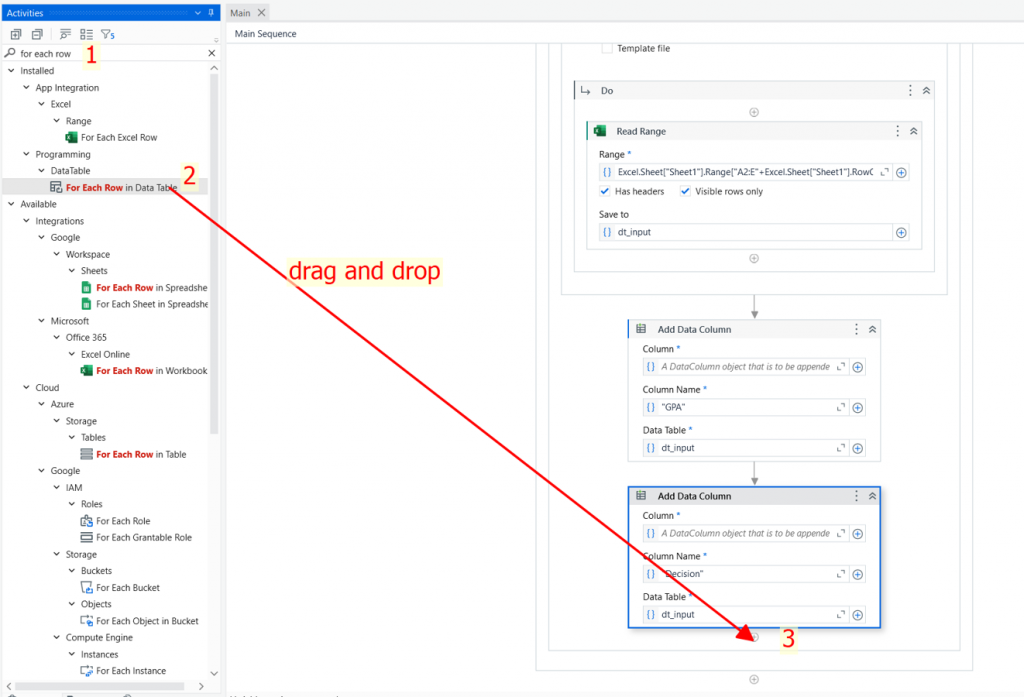
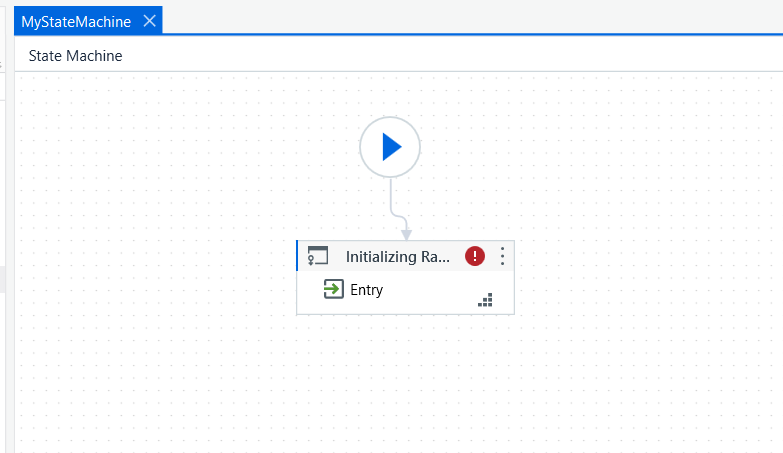
Bước 4: Kéo thả State Activity và kết nối tới Start node trong StateMachine.
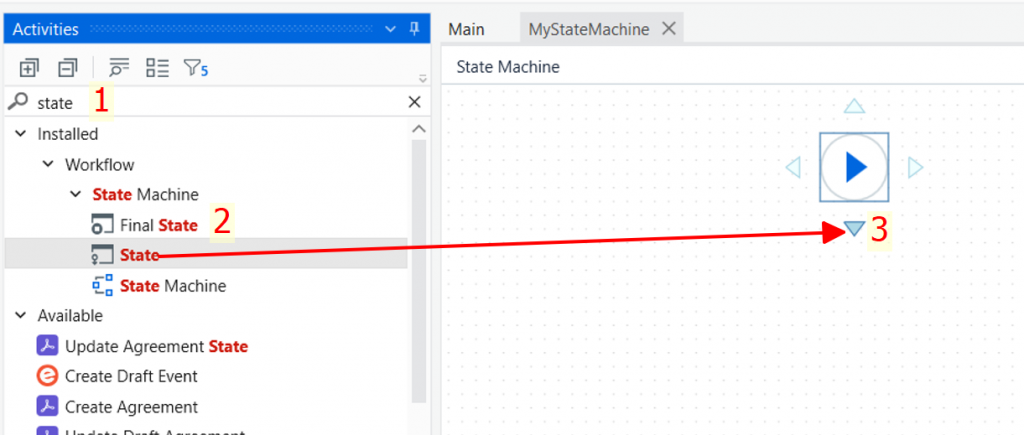
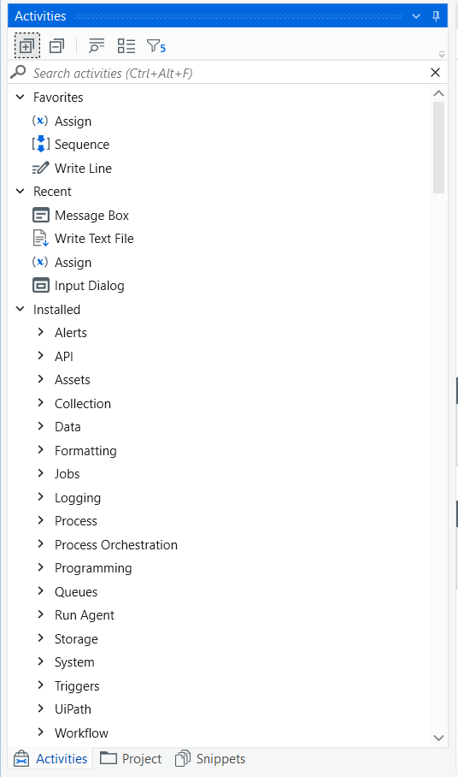
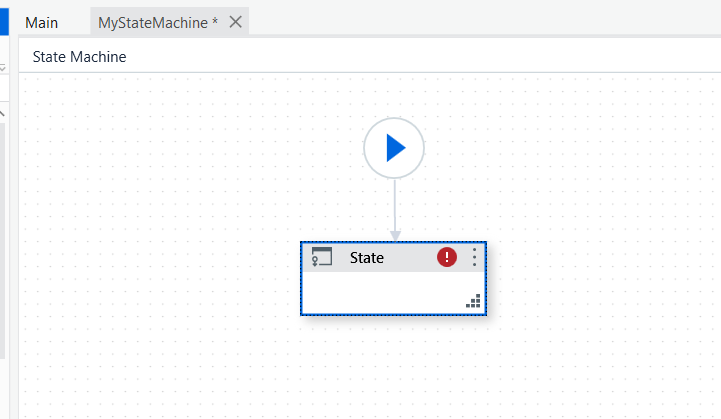
Ta vào thẻ Activities, gõ từ khóa “state” tìm State Activity và kéo thả vào MyStateMachine, lúc bạn kéo thả vào thì di chuyển vào Start Node để kết nối, kết quả:
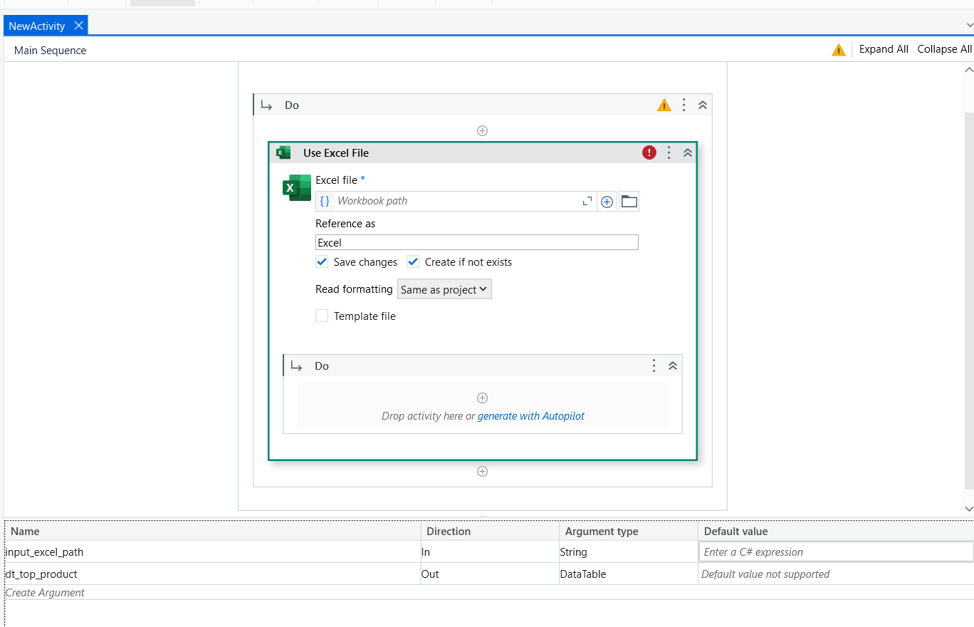
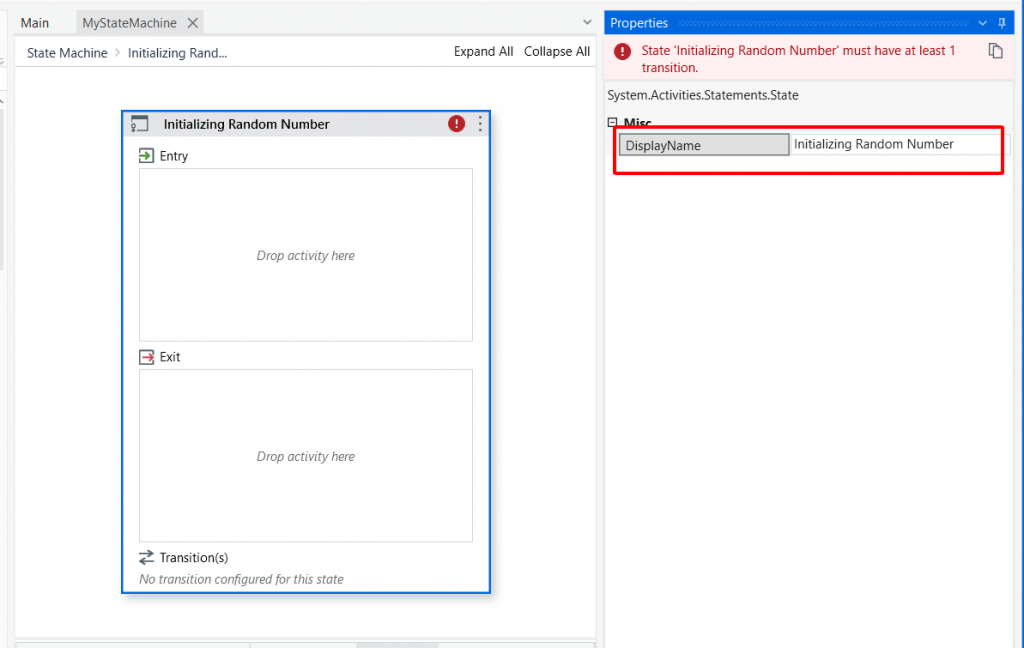
Ta tiến hành cấu hình cho State khởi tạo này bằng cách Double-Click vào State:
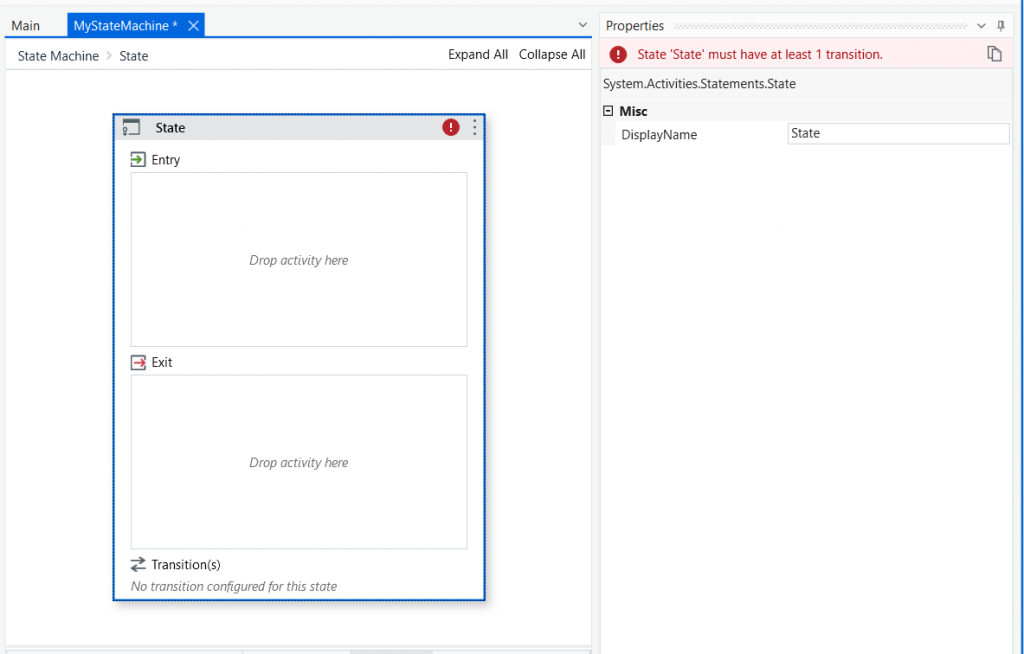
- DisplayName: Initializing Random Number
- Entry: Kéo thả Assign Activity vào để tạo giá trị ngẫu nhiên cho RandomNumber. Cách kéo thả Activity bạn đã biết.
Bước 5: Kéo thả Assign Activity để gán giá trị ngẫu nhiên cho RandomNumber
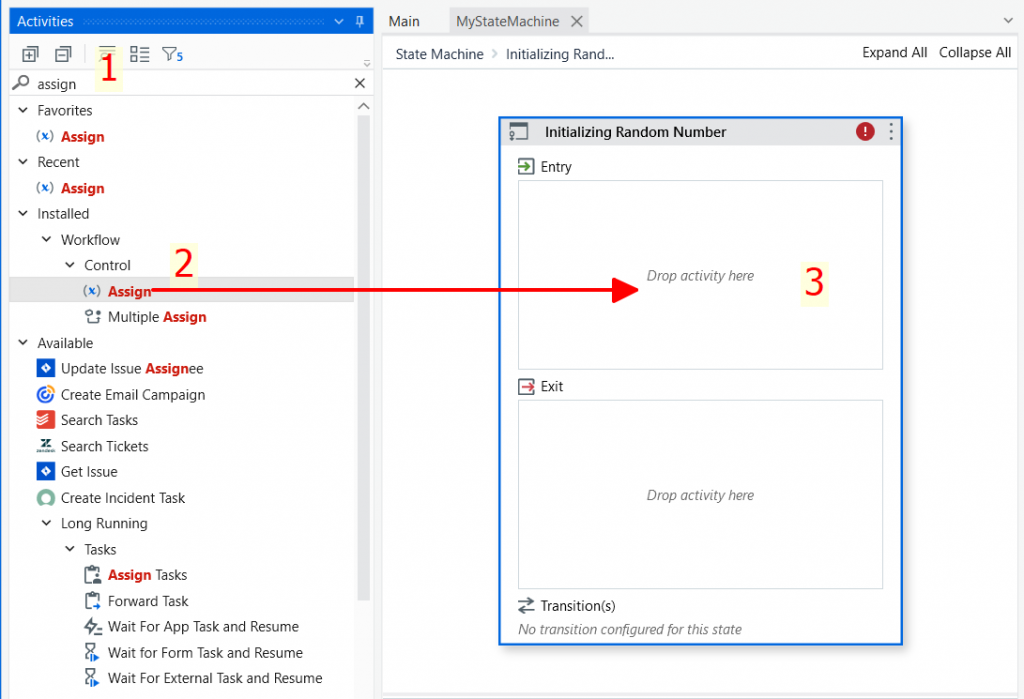
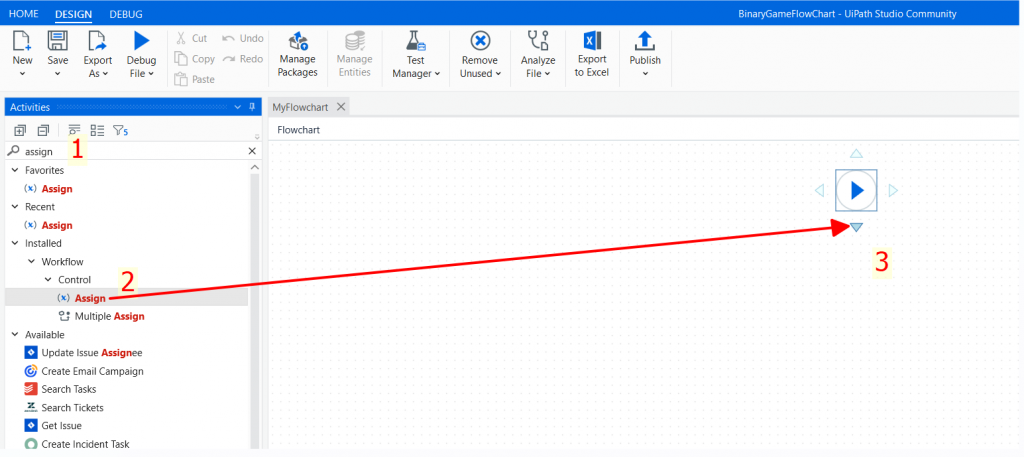
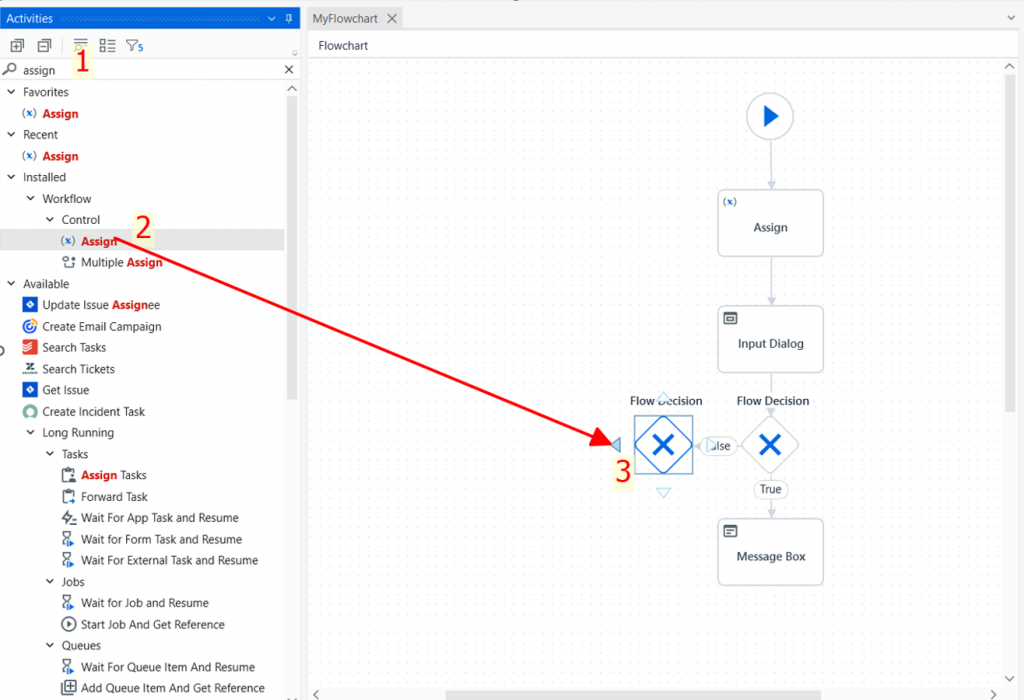
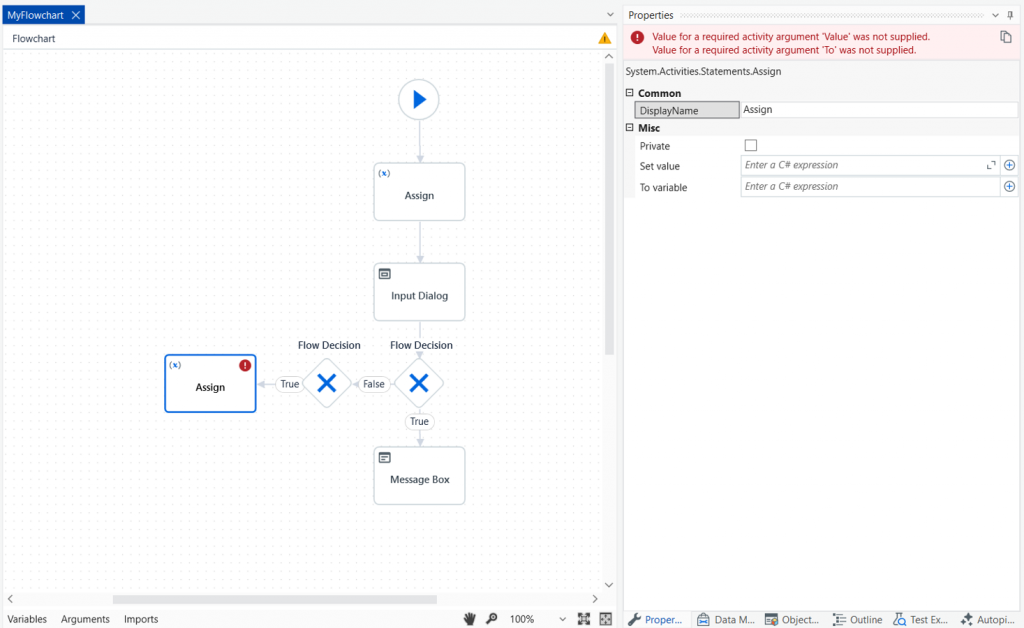
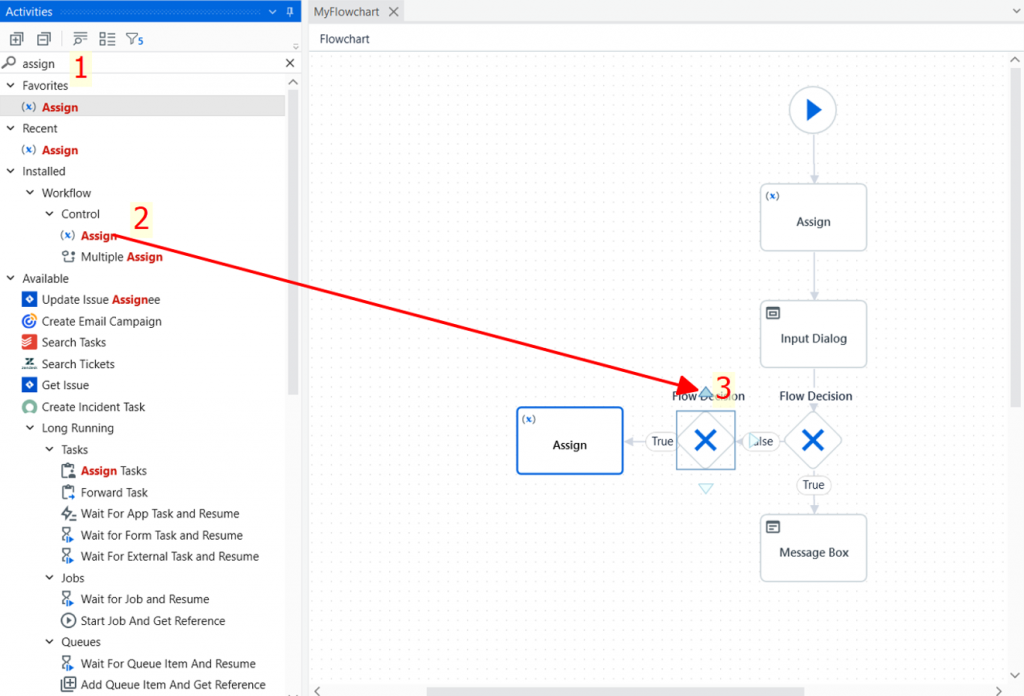
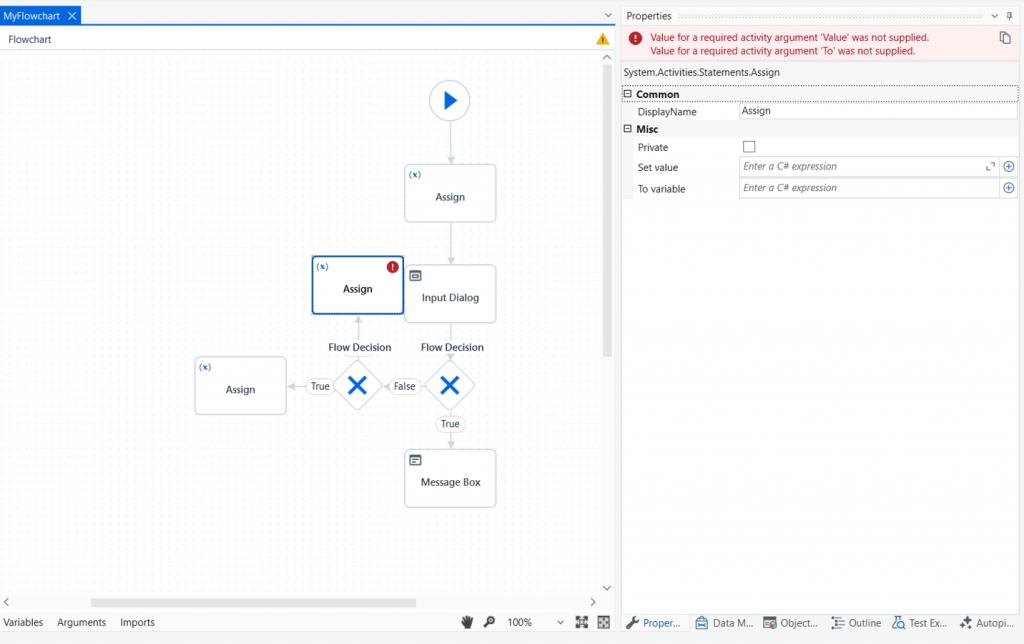
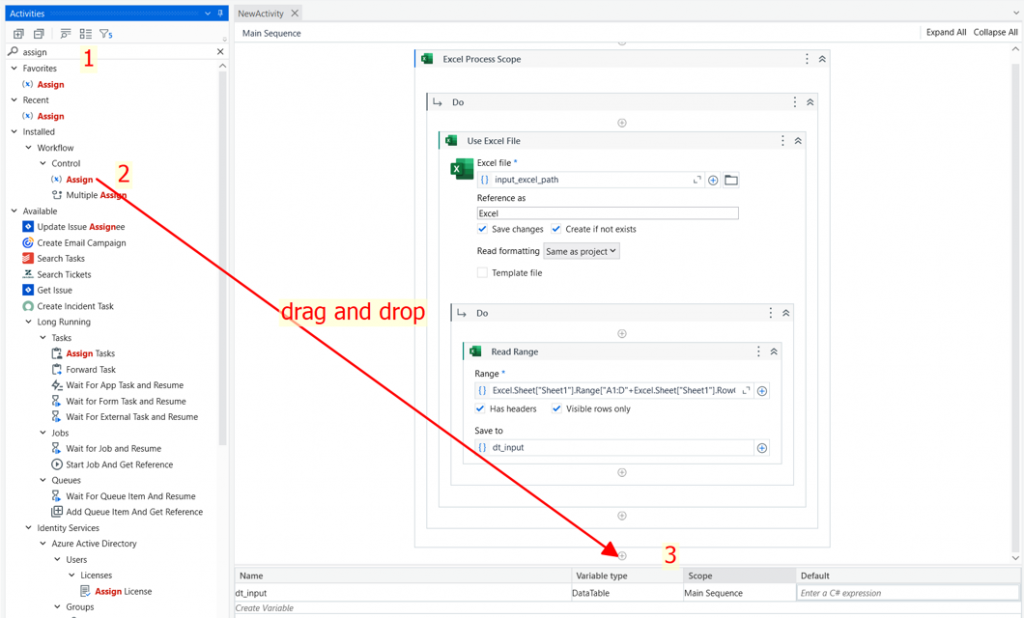
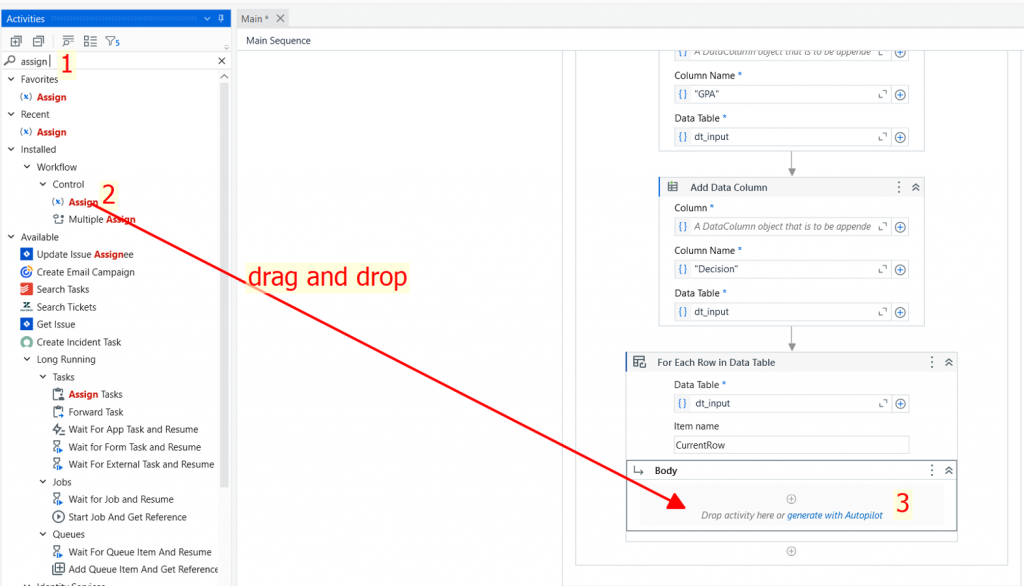
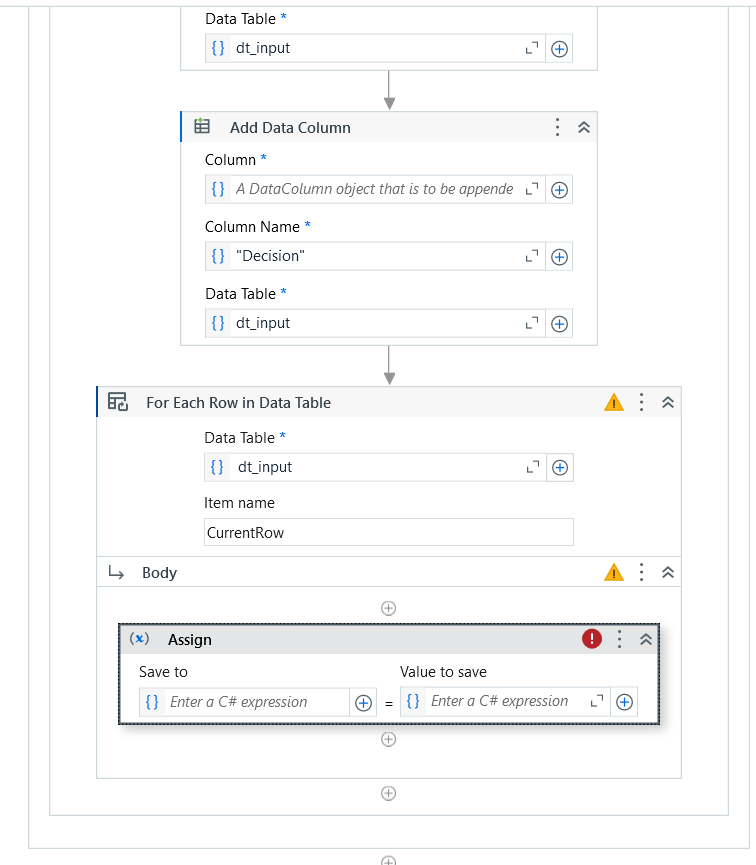
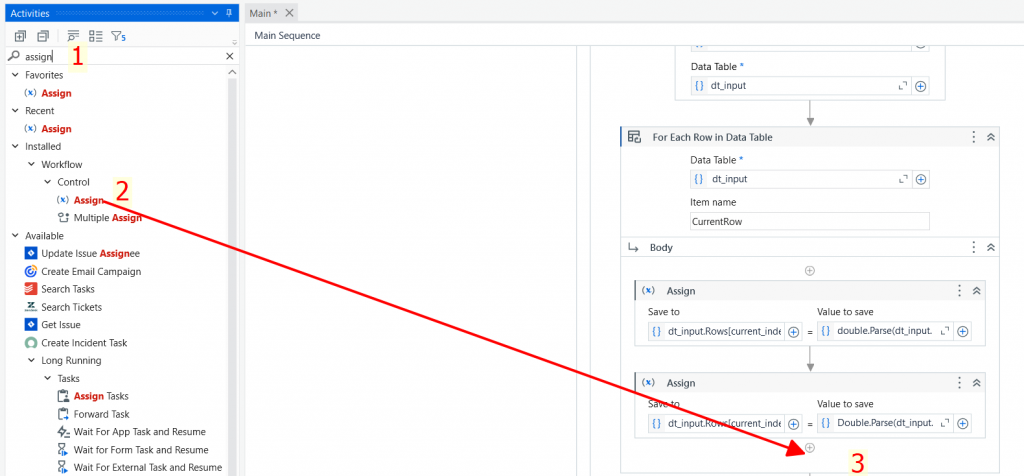
Ta vào thẻ Activities, gõ từ khóa assign rồi kéo thả Assign Activity vào phần Entry như hình minh họa, kết quả:
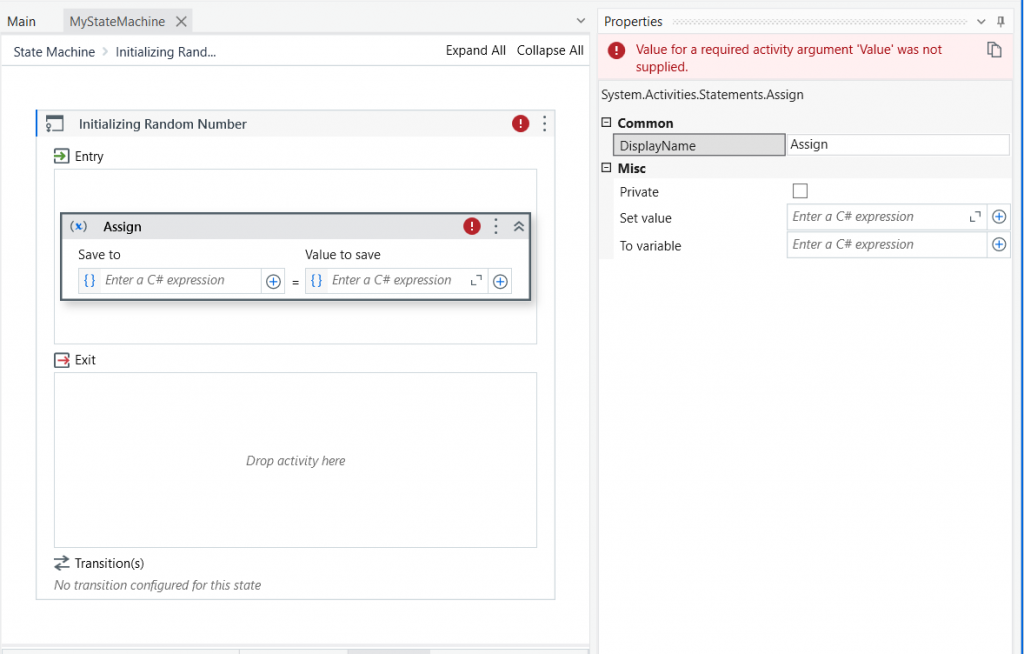
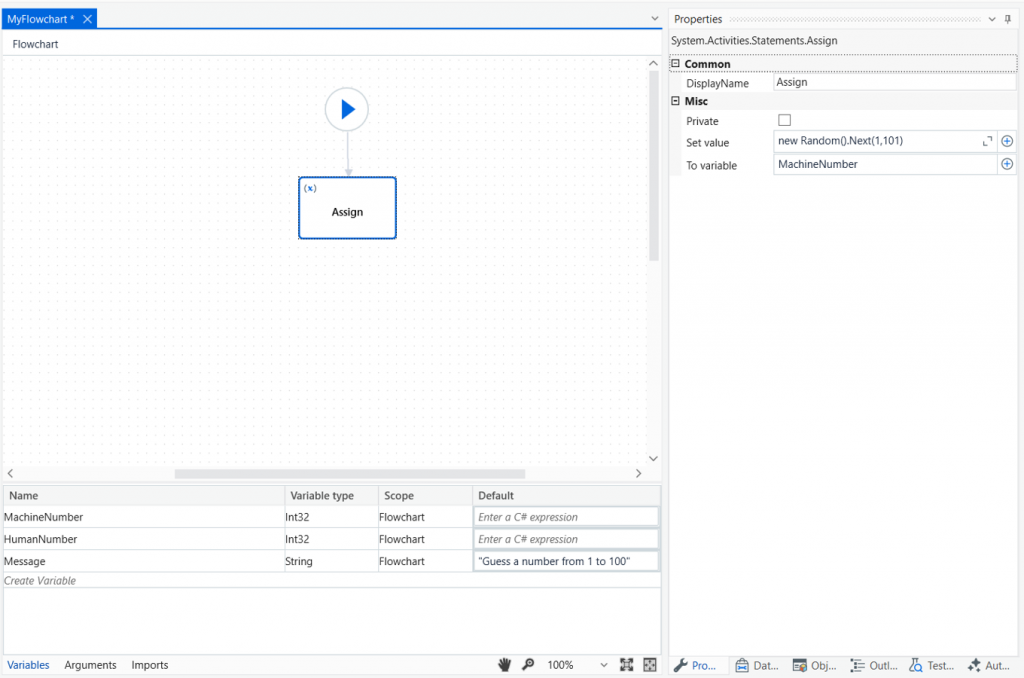
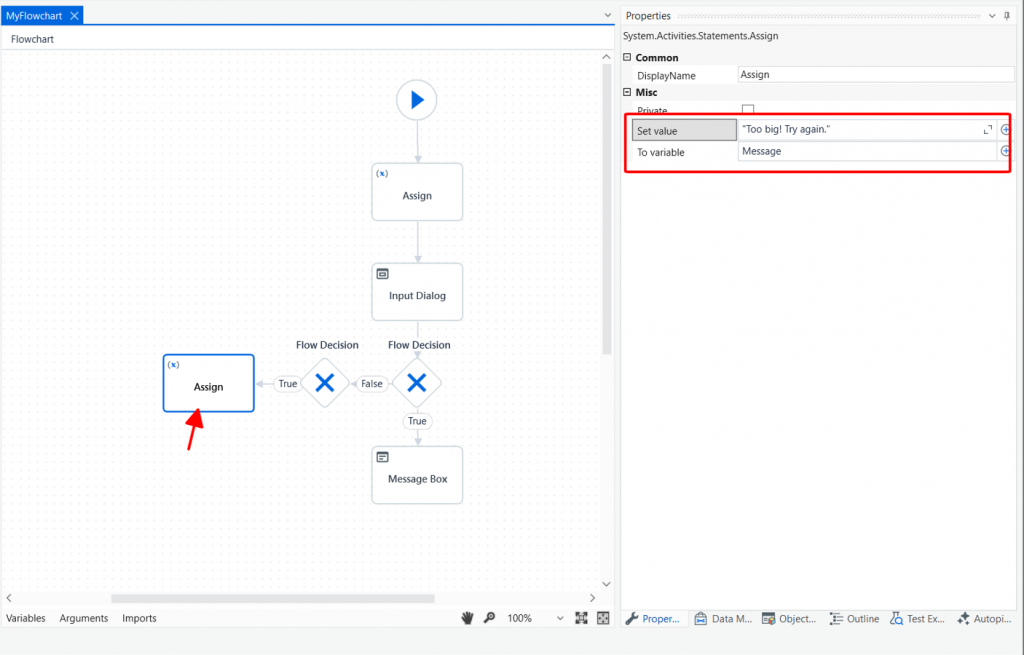
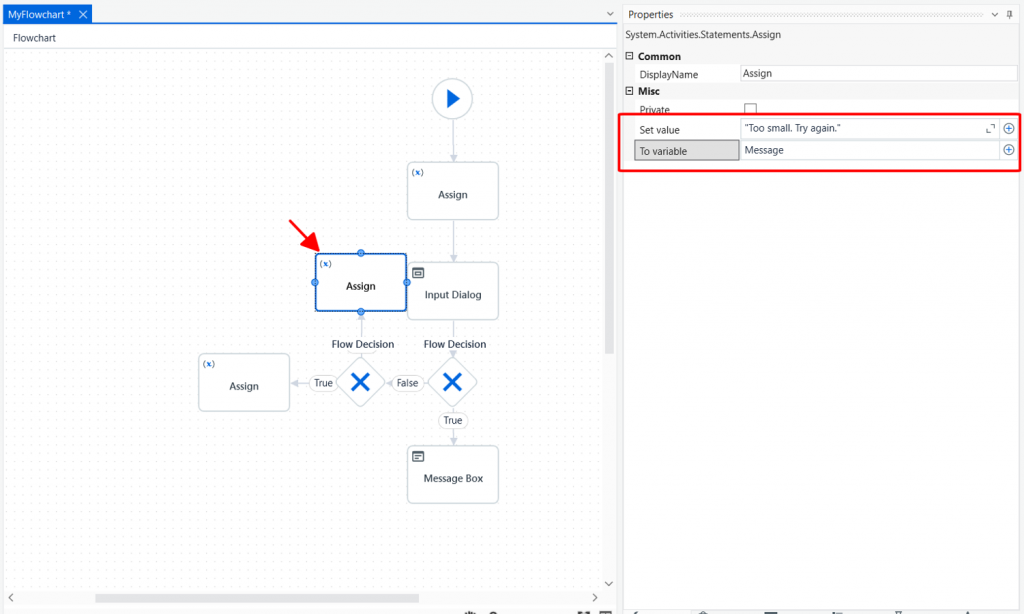
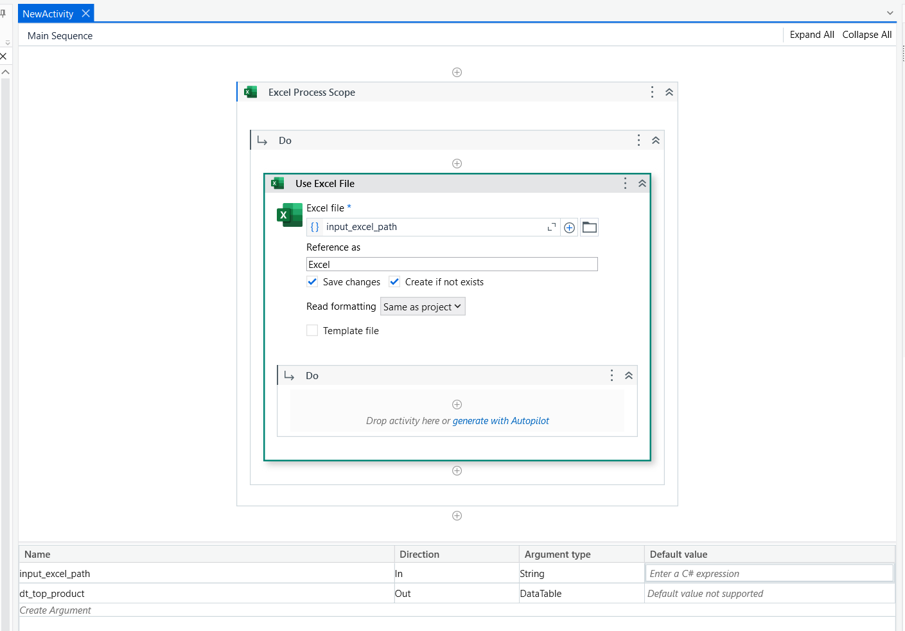
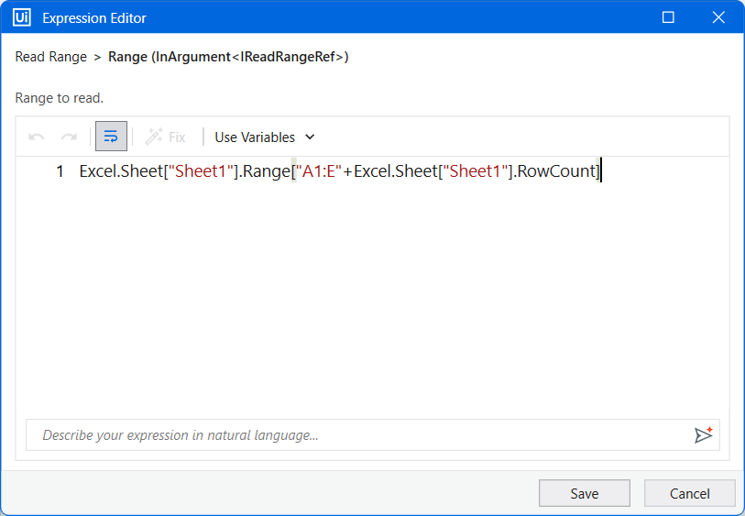
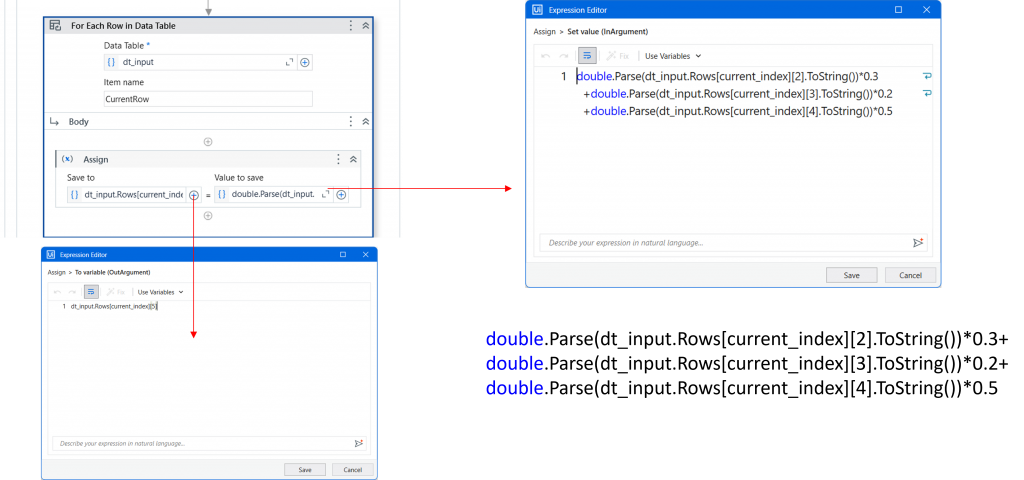
- Set value ta viết mã lệnh để tạo số ngẫu nhiên từ 1 tới 100
new Random().Next(1,100)- To variable ta gán cho biến RandomNumber
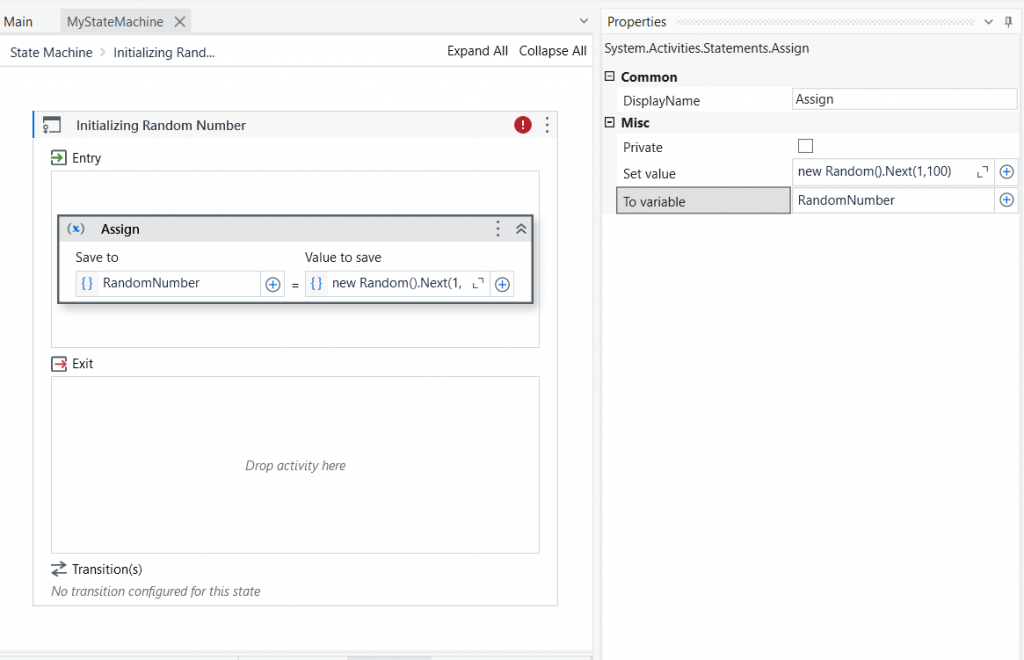
Sau khi cấu hình xong, ta quay lại màn hình chính bằng cách bấm vào link “State Machine” ở phía trên màn hình góc bên trái (dùng dòng với các chữ Expand All và Collapse All), kết quả:
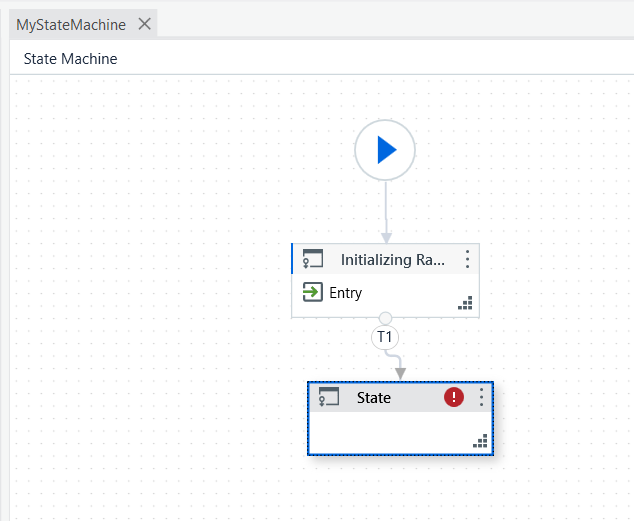
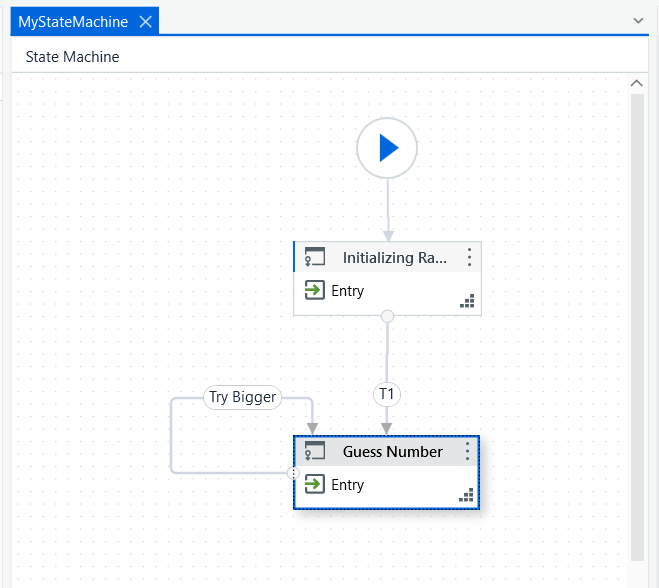
Bước 6: Kéo thả một State và kết nối State này với State (Initializing Random Number) vừa tạo ở bước trước.
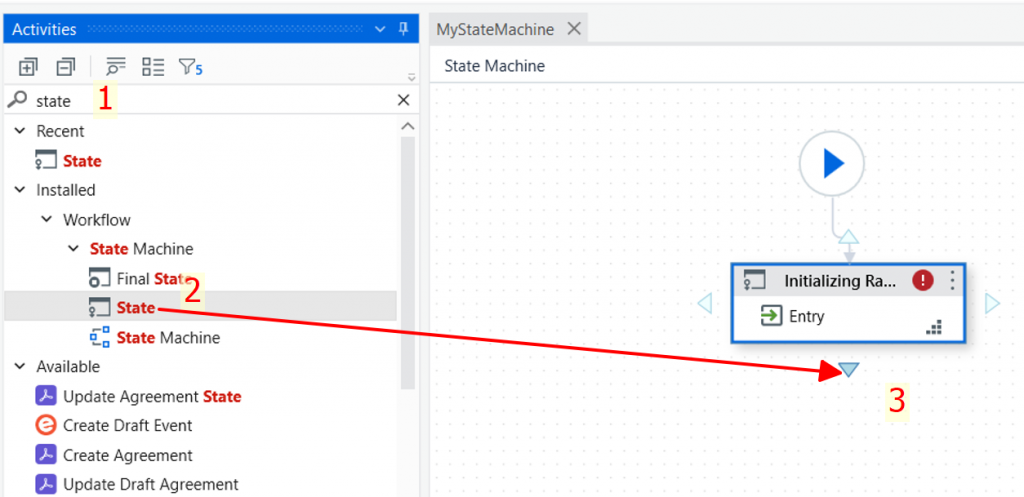
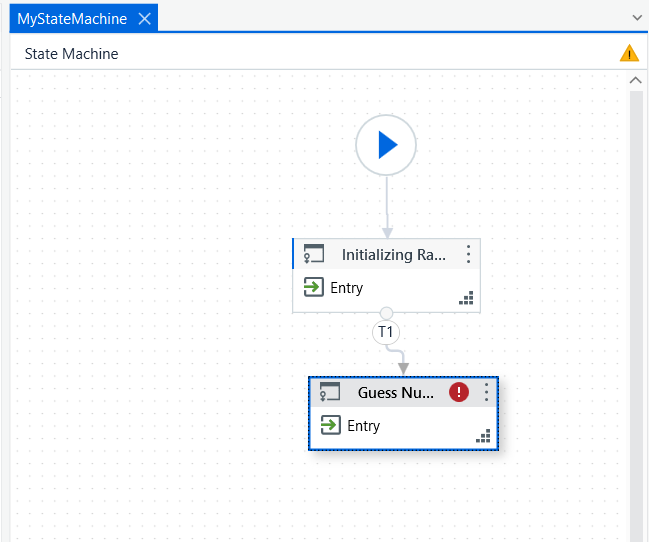
Trong thẻ Activities, ta gõ từ khóa state rồi kéo Sate Activity vào màn hình chính như hình minh họa, kết nối State này với State ở bước trước. Lúc kéo State ta di chuyển nó vào State ở bước trước nó sẽ xuất hiện ra các mũi tên, kết quả:
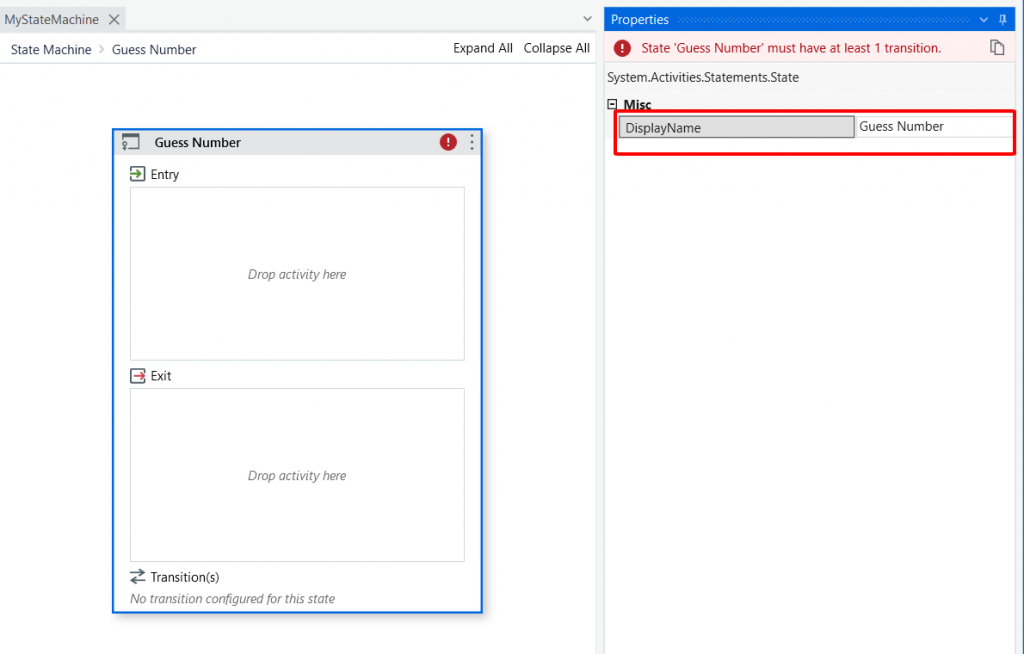
State này có nhiệm vụ yêu cầu người chơi đoán số. Ta Double-click vào State này để cấu hình:

- DisplayName: Guess Number
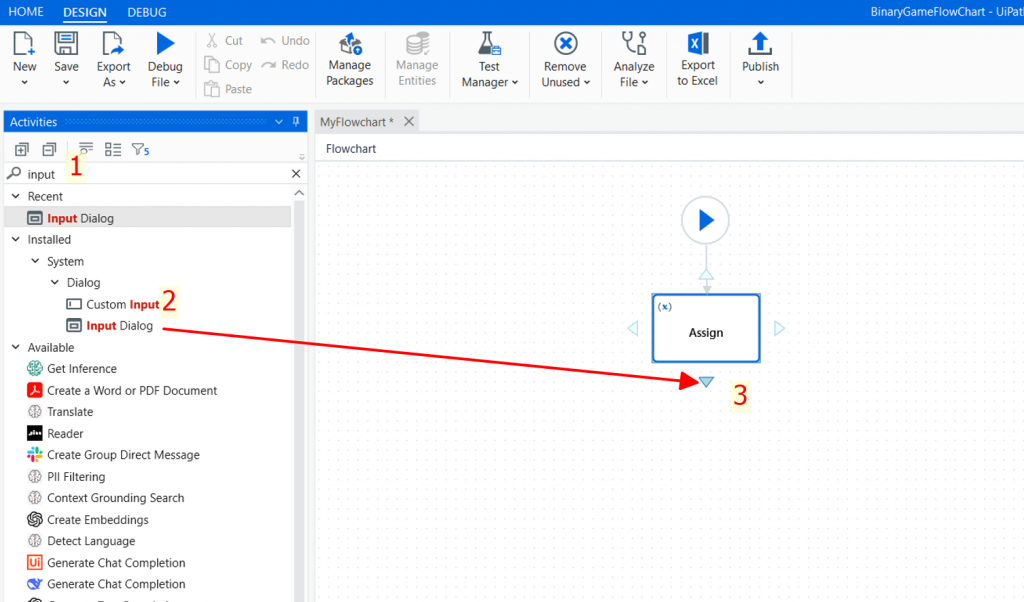
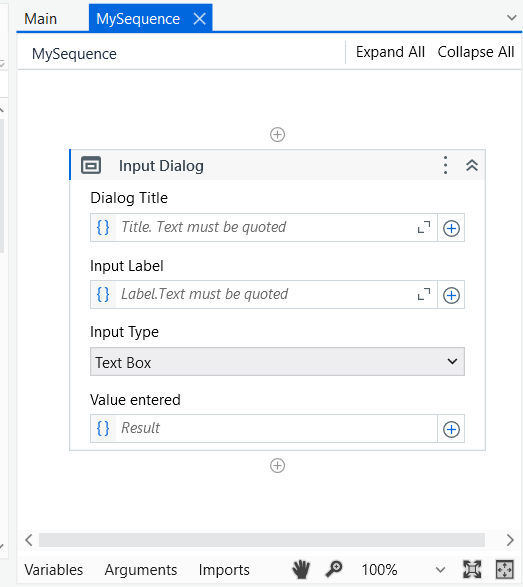
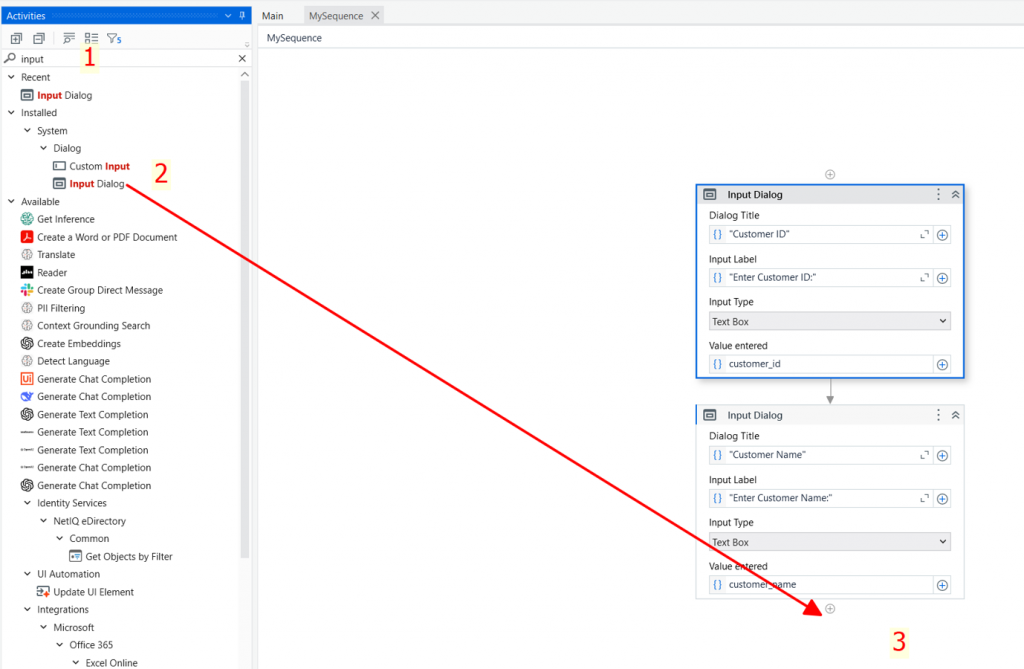
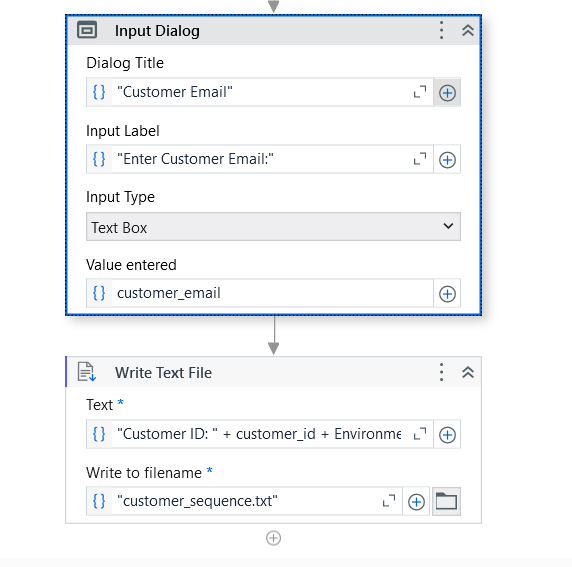
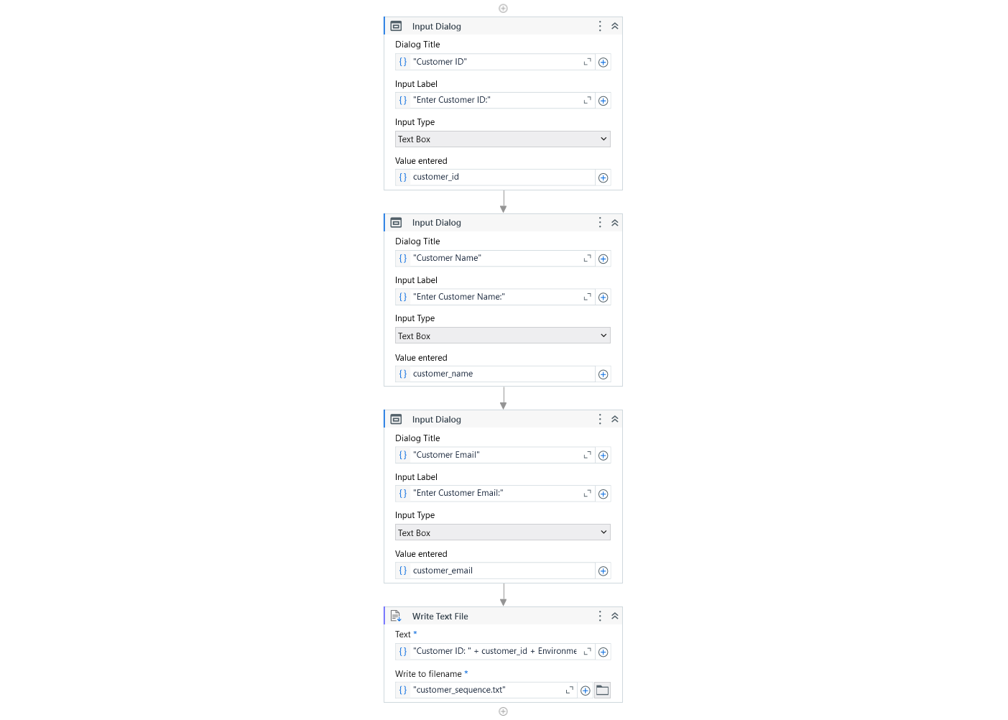
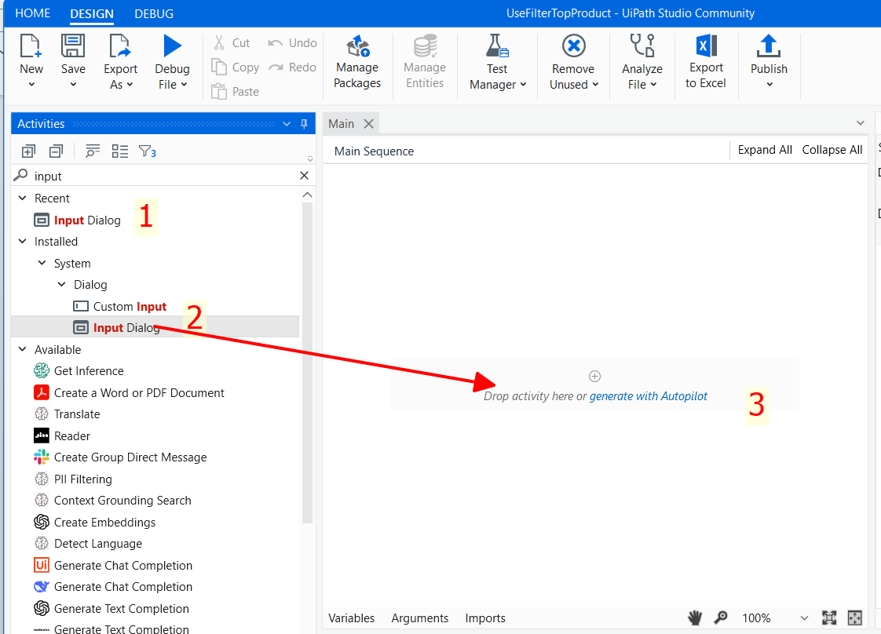
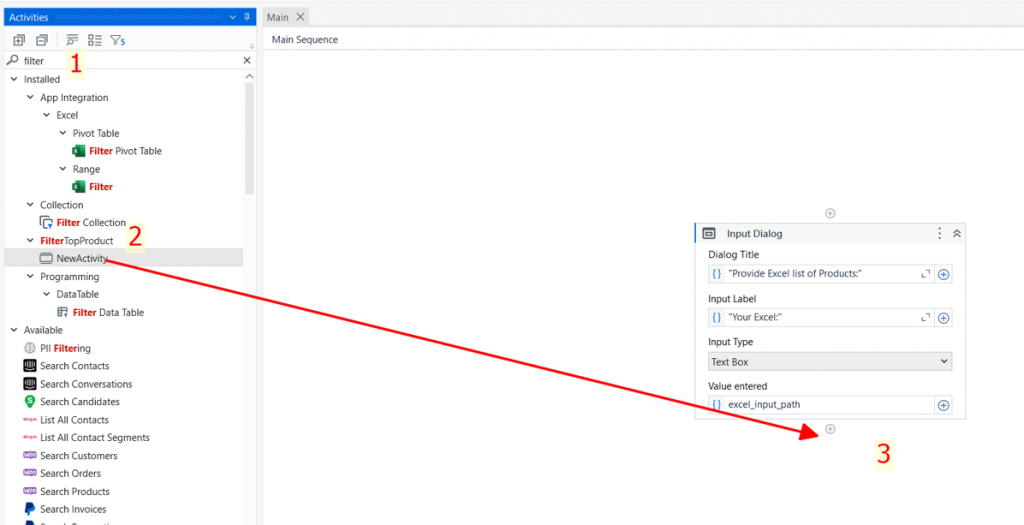
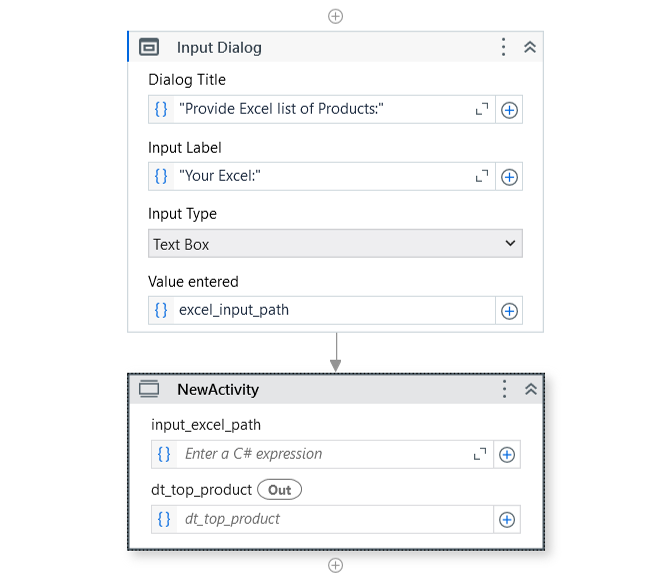
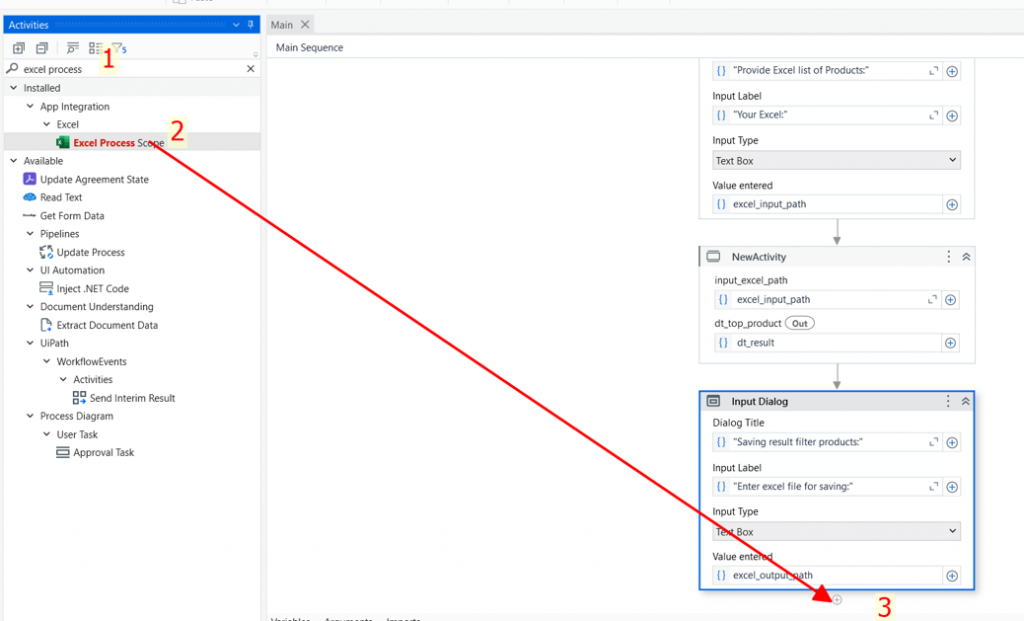
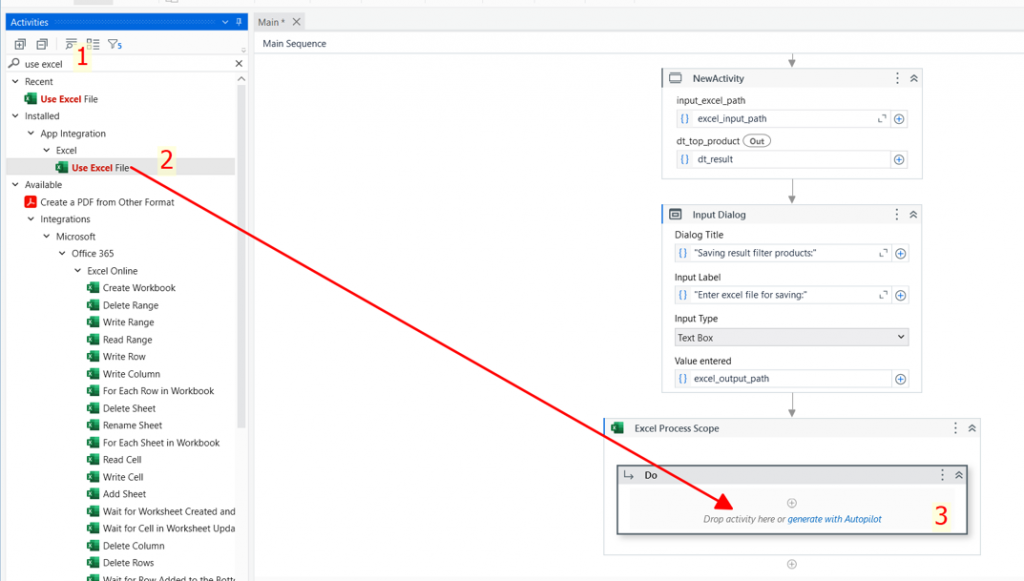
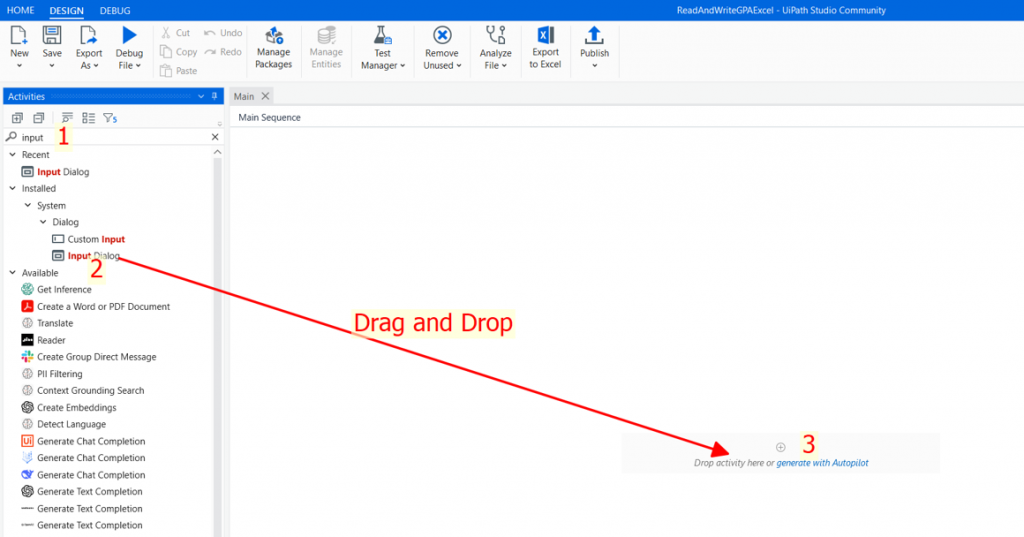
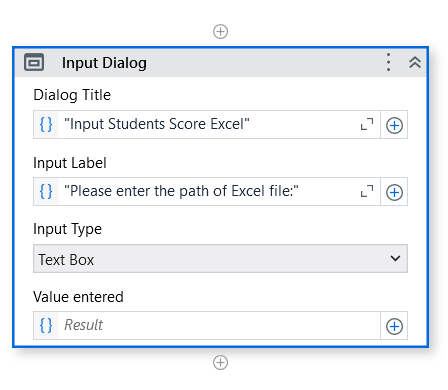
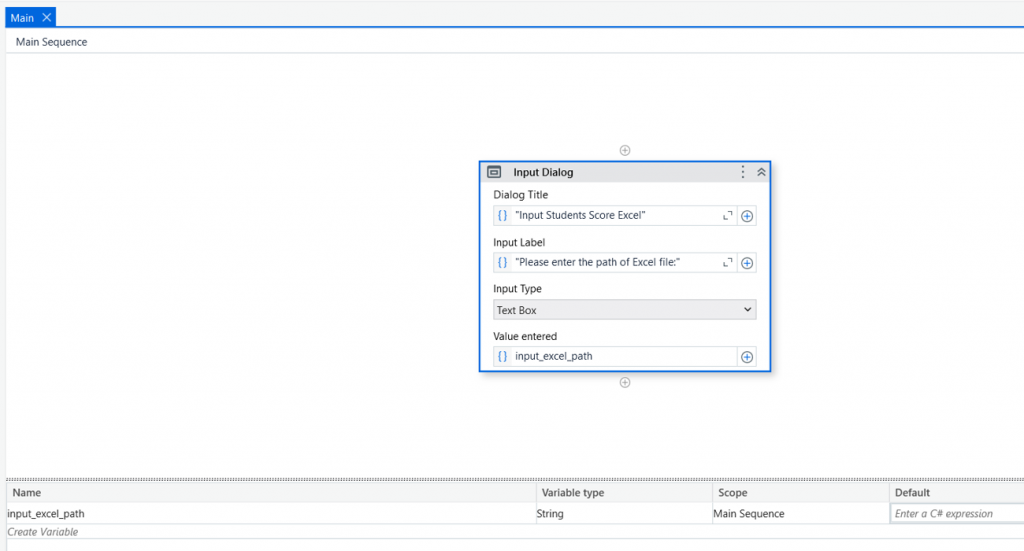
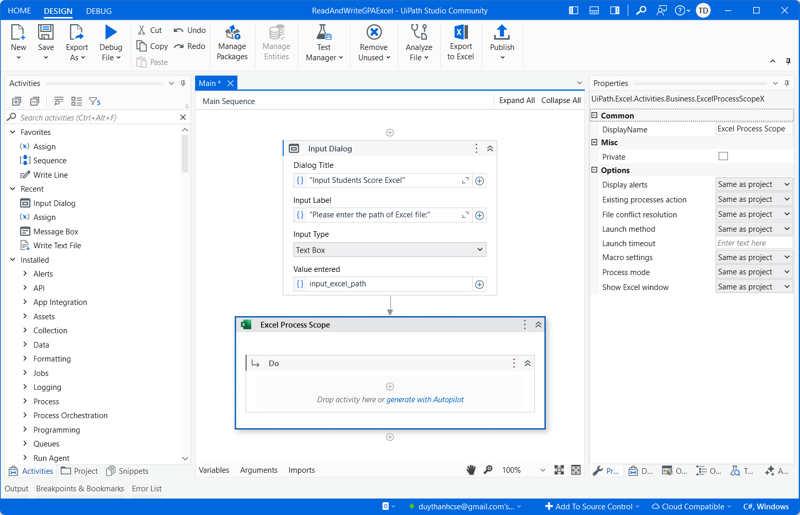
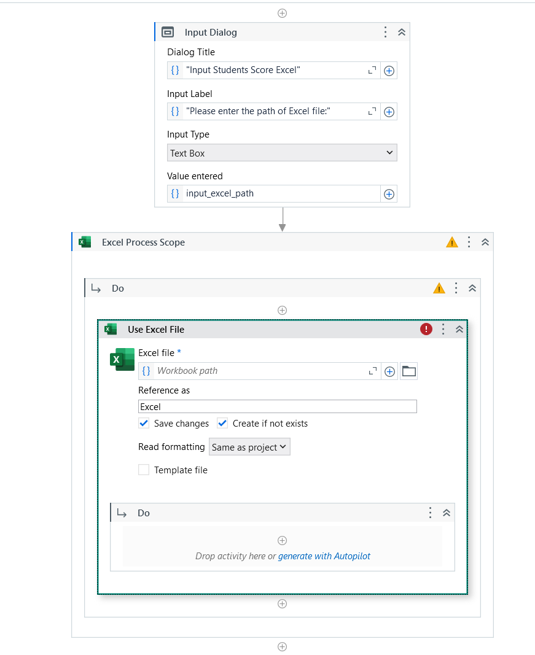
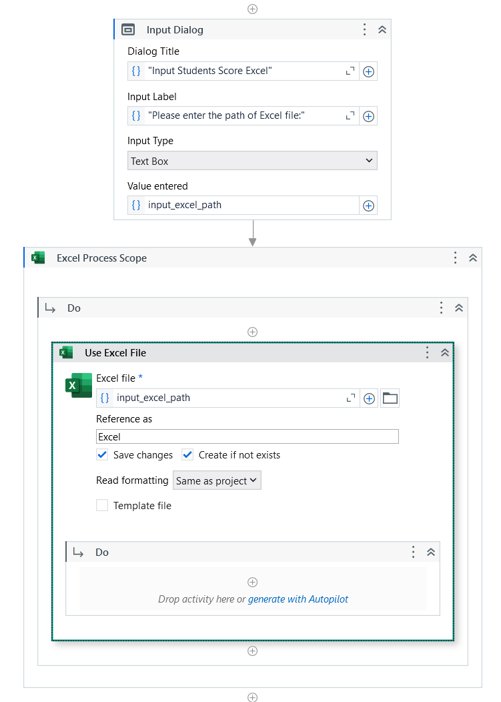
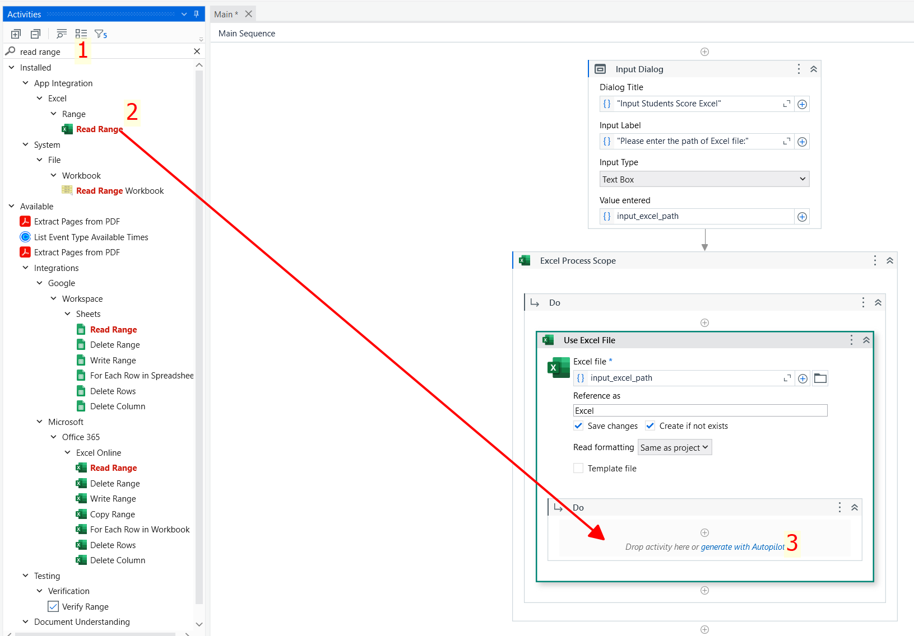
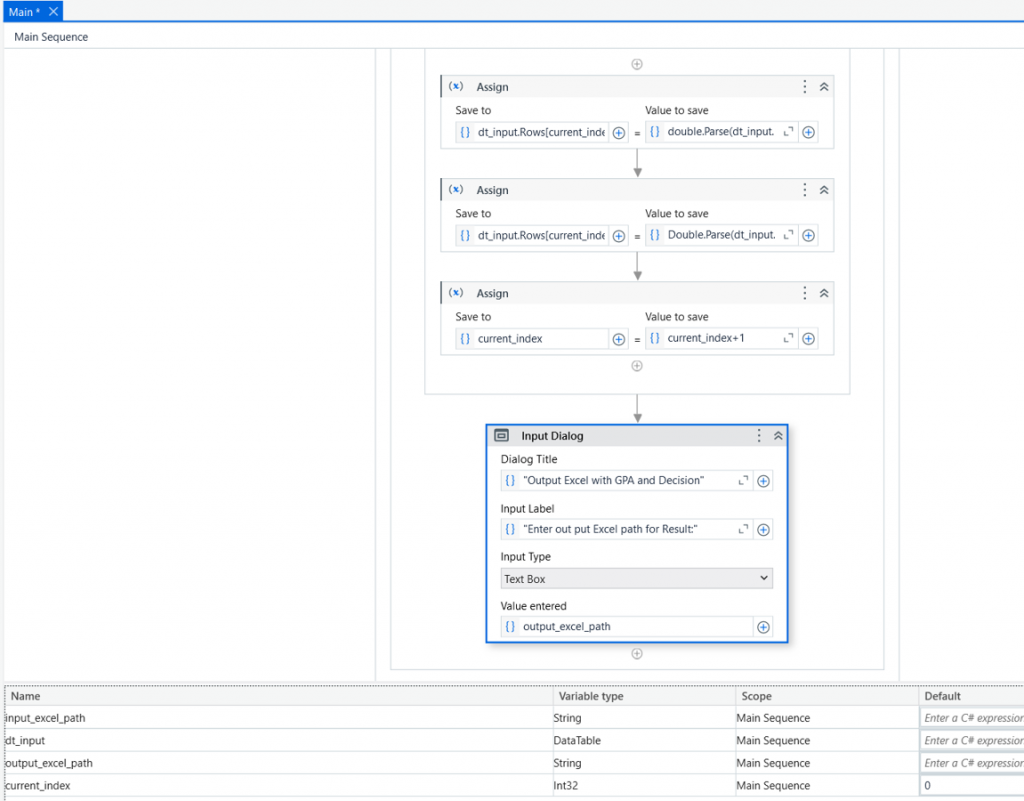
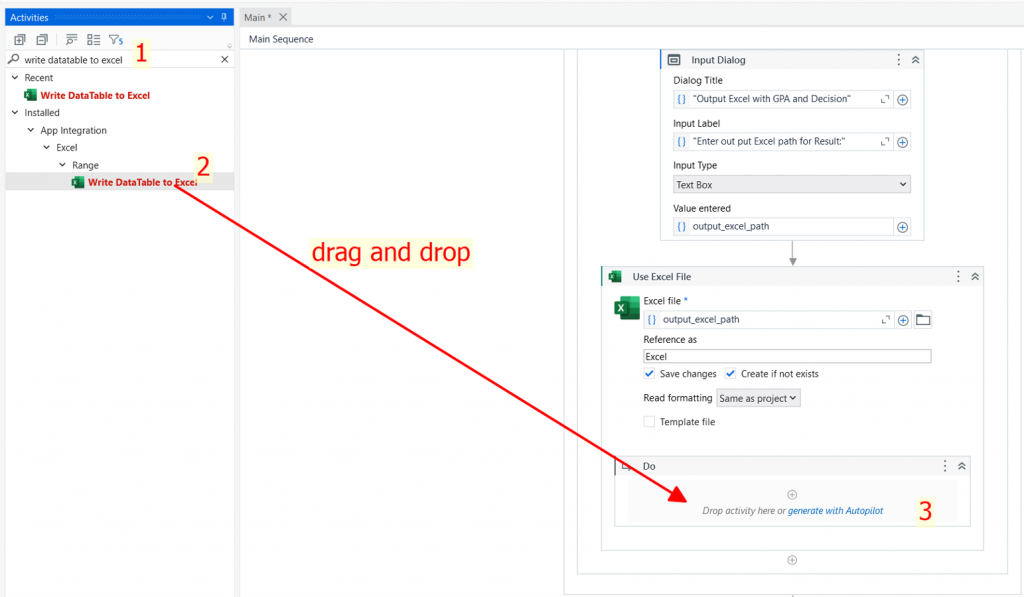
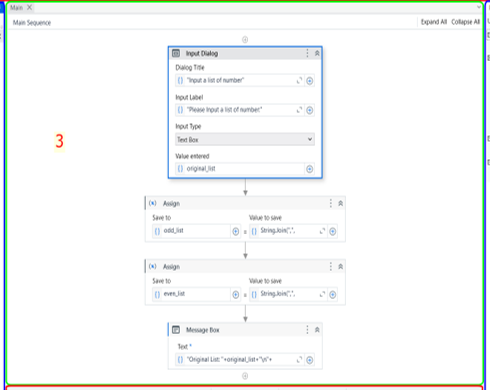
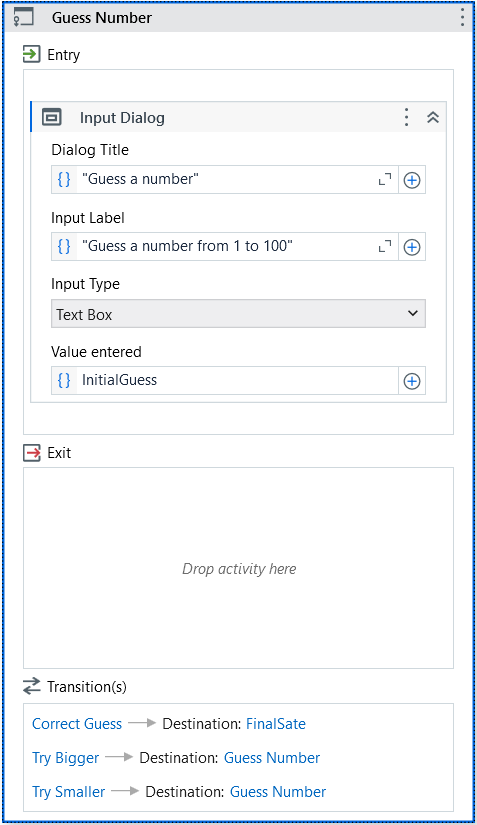
Bước 7: Kéo thả InputDialog Activity vào phần Entry của State Guess Number
InputDialog này yêu cầu người chơi đoán một số
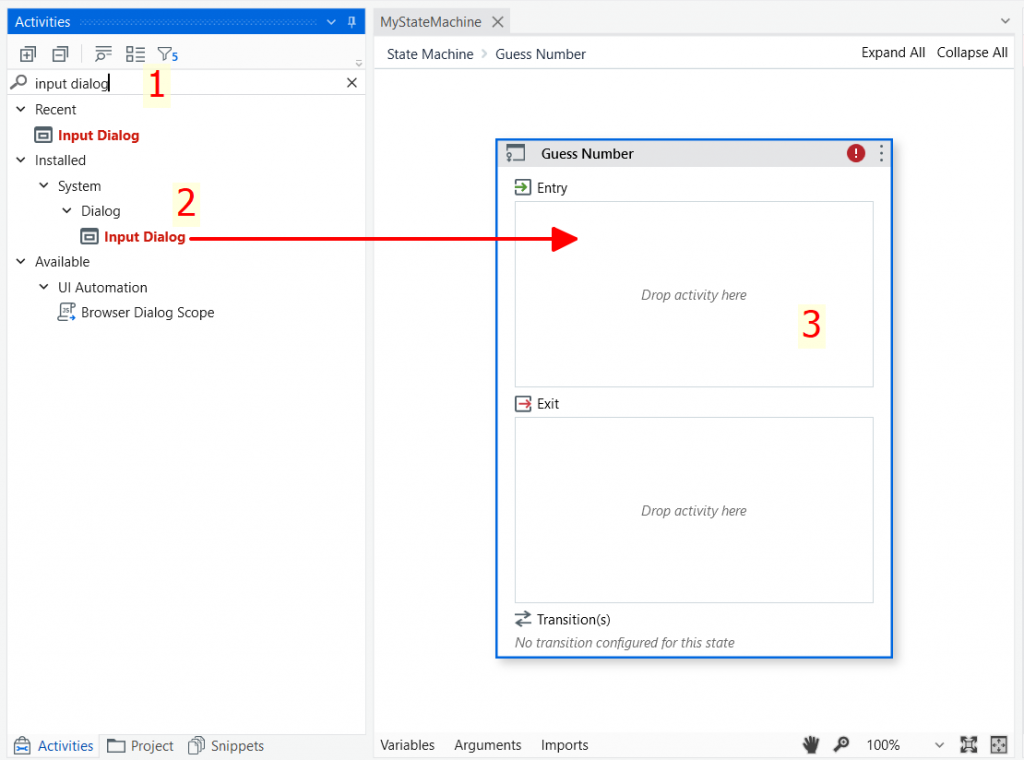
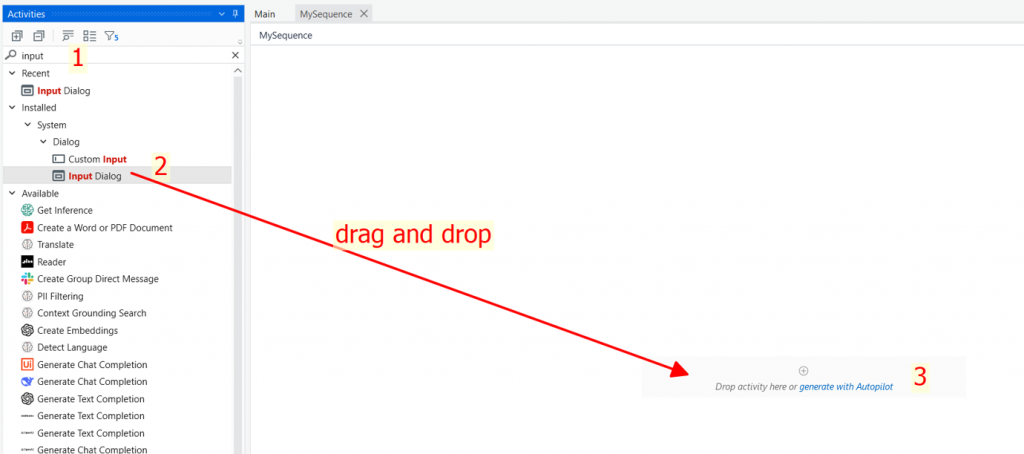
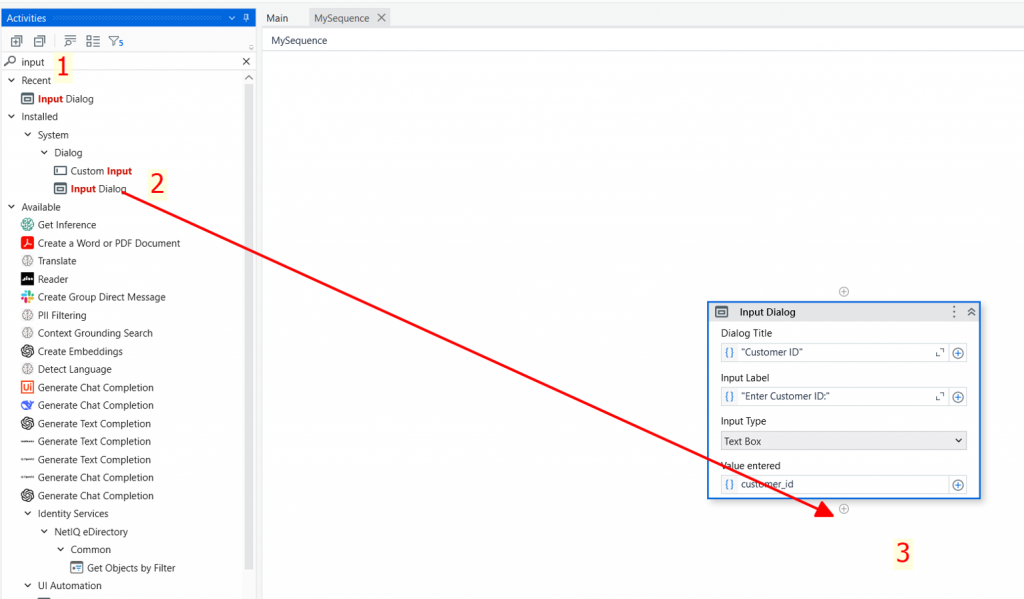
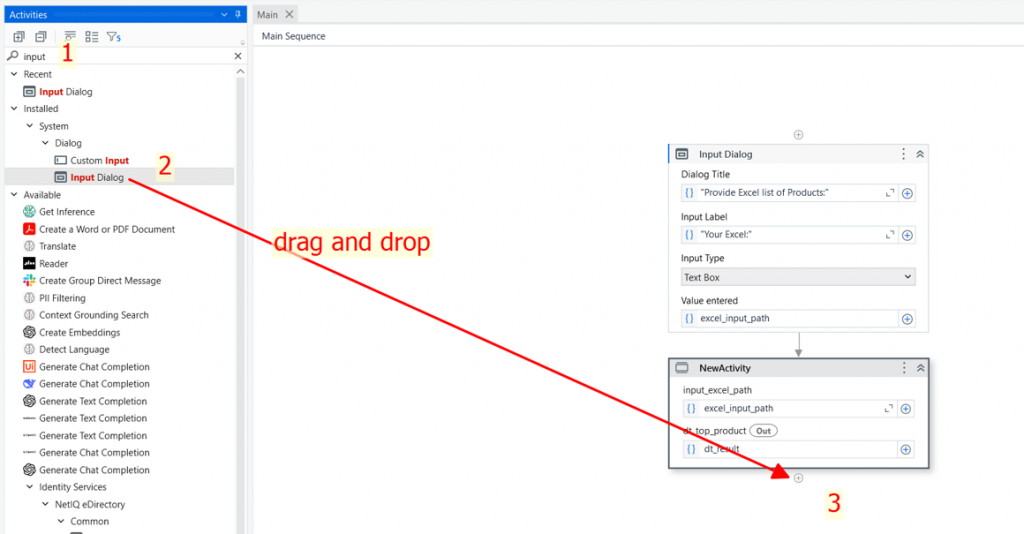
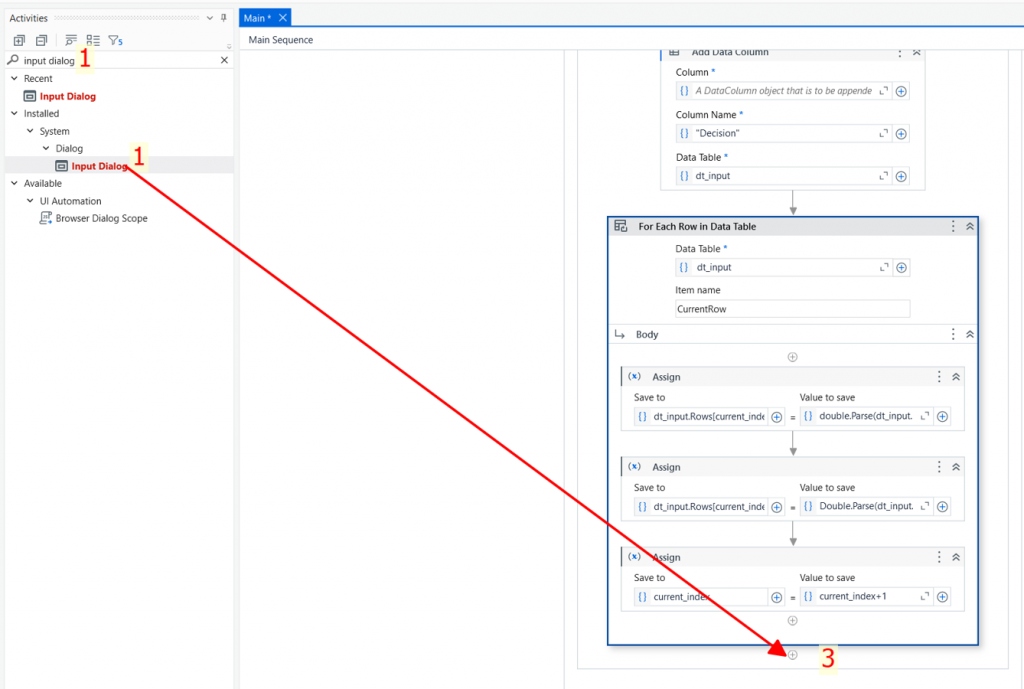
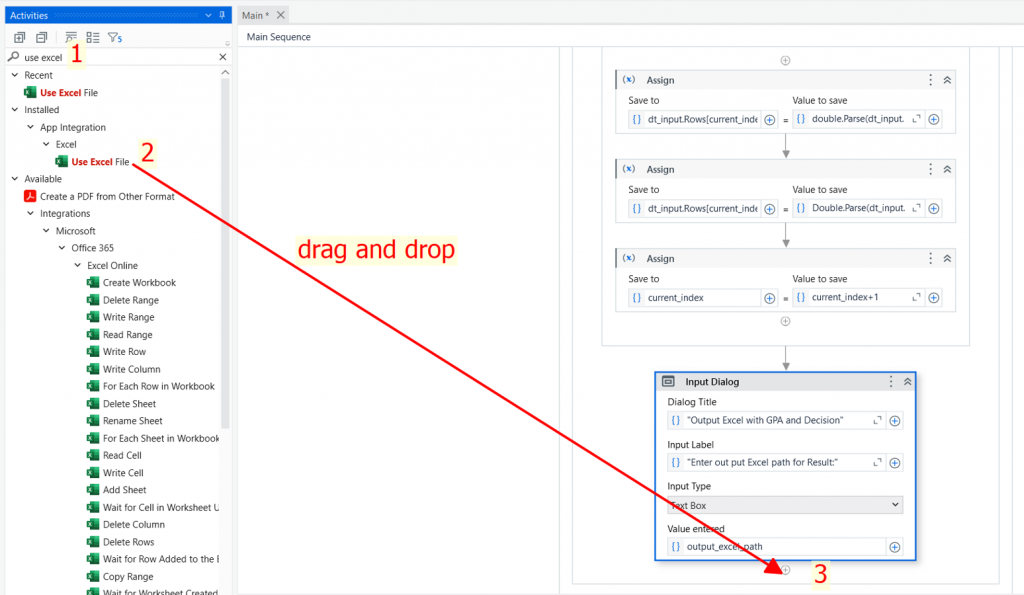
Từ thẻ Activities, ta gõ từ khóa Input dialog rồi kéo Activity này vào mục Entry của State Guess Number như hình minh họa ở trên, kết quả:
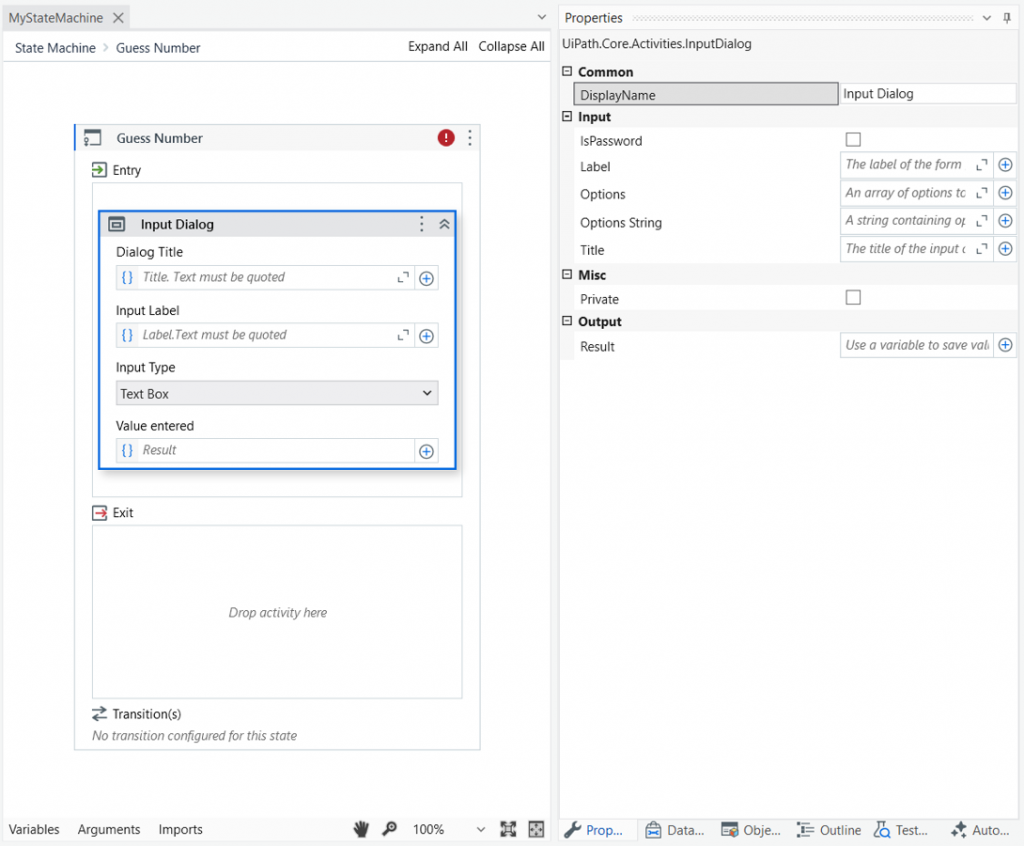
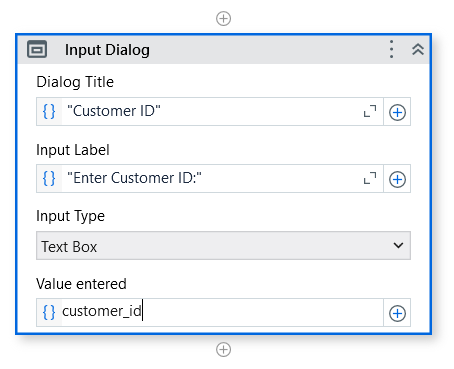
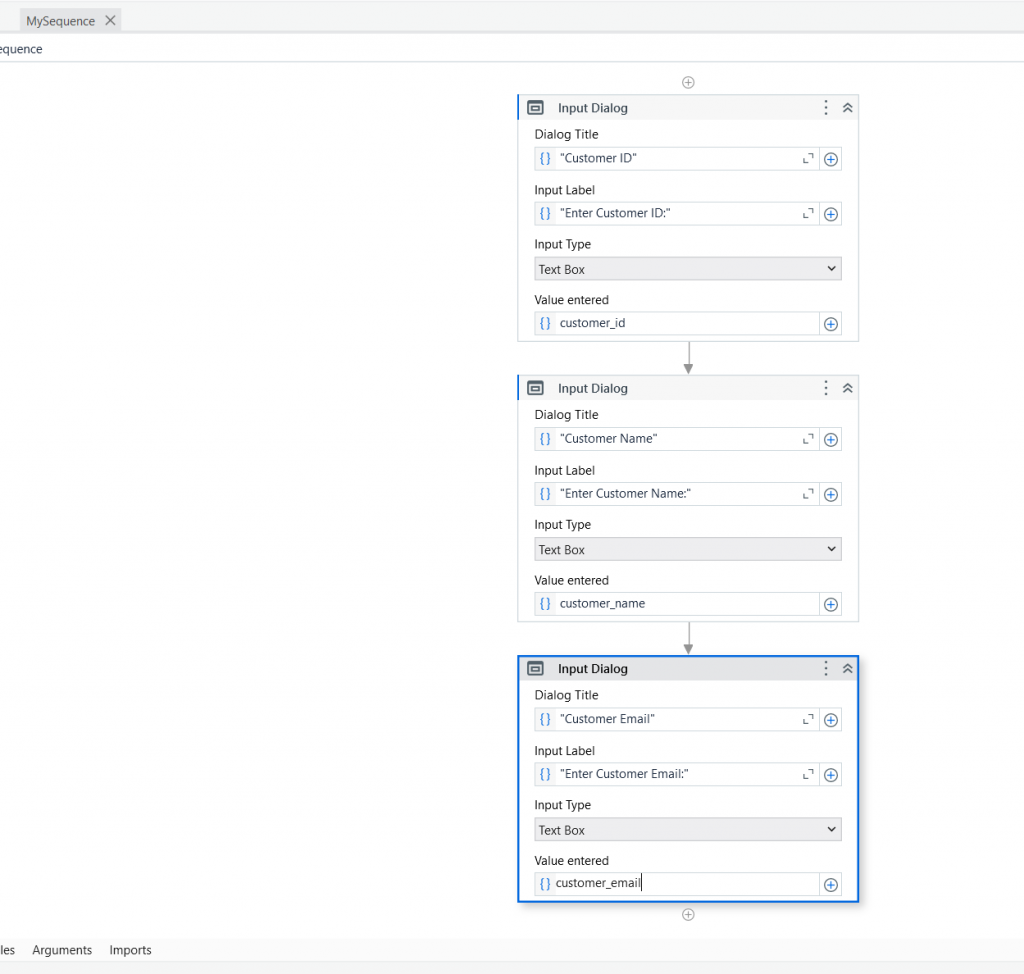
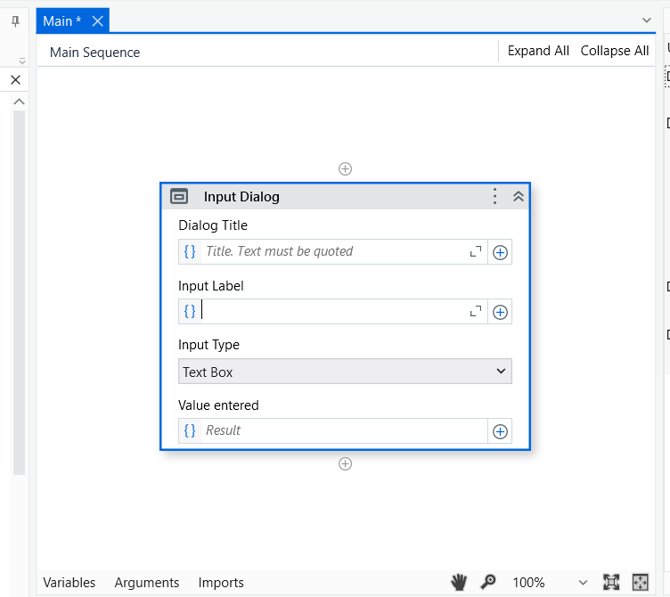
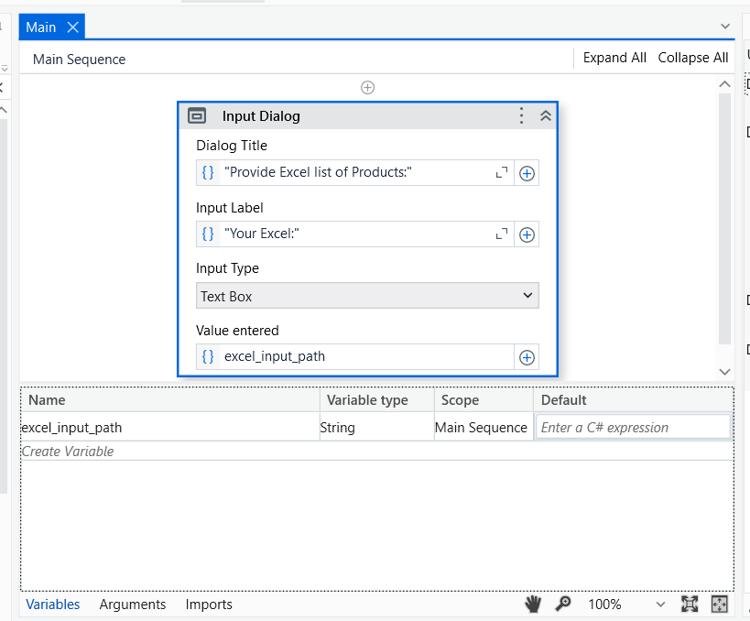
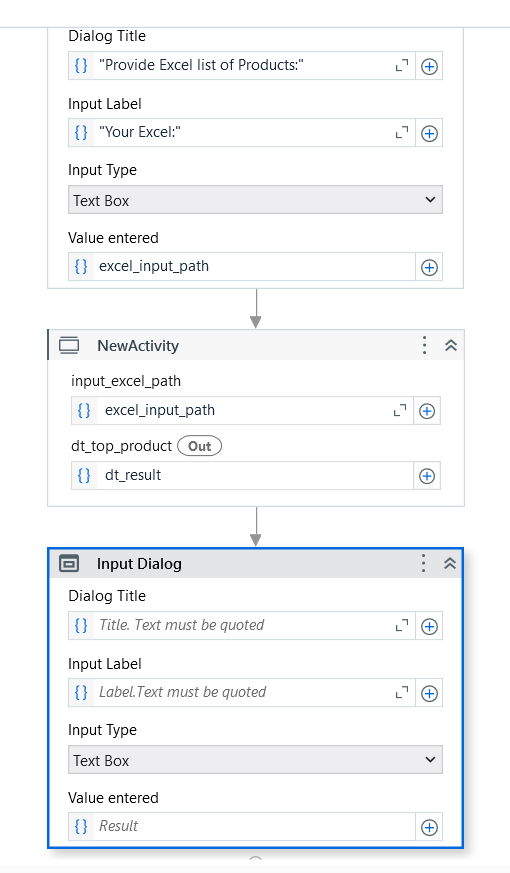
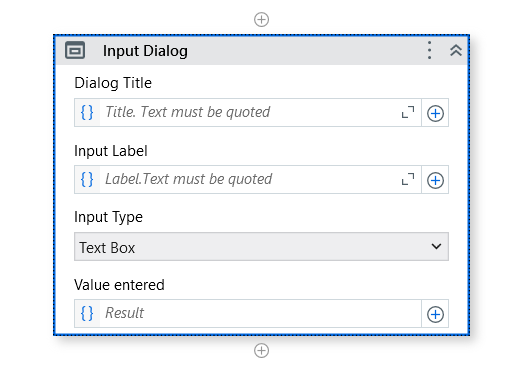
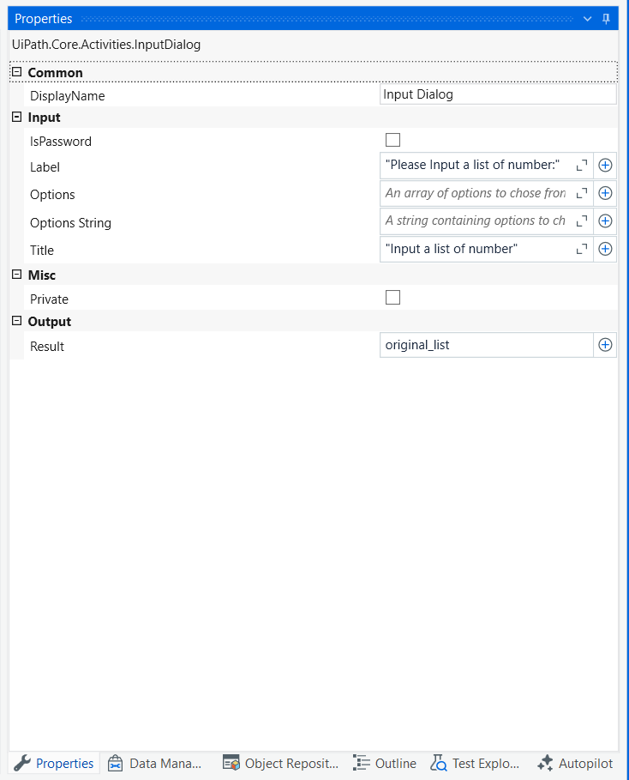
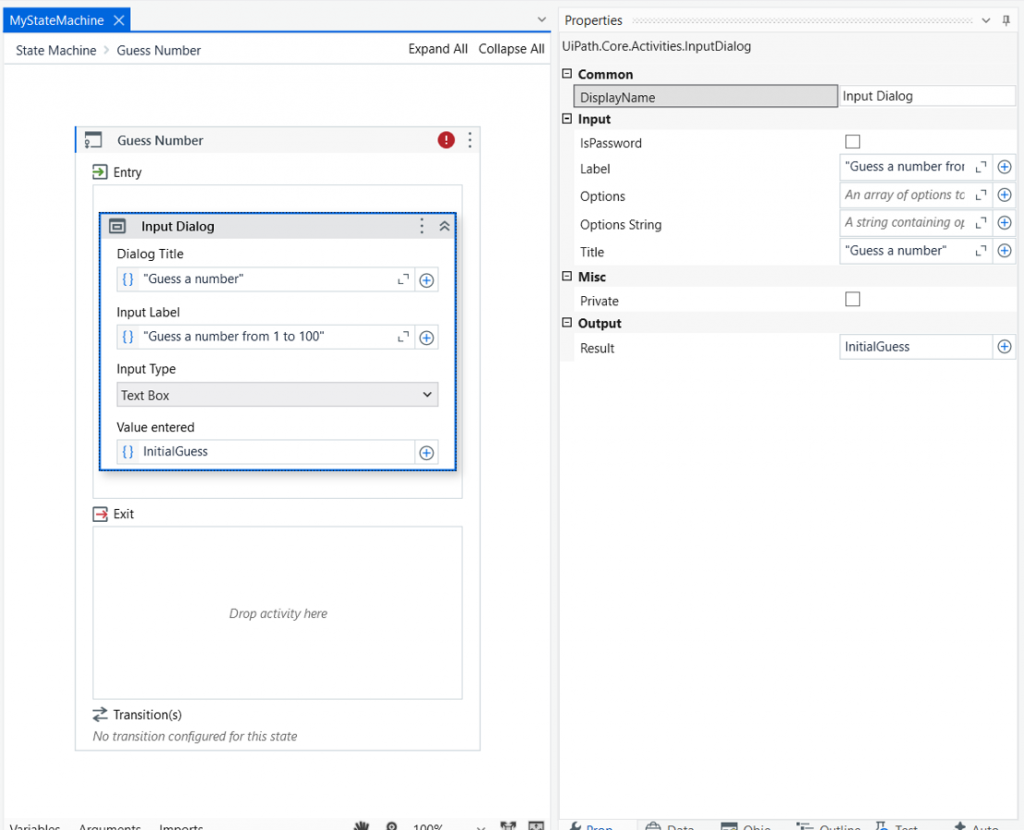
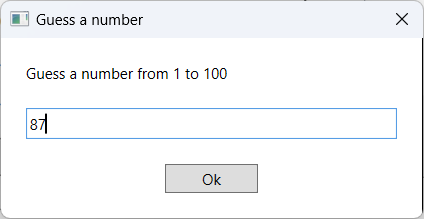
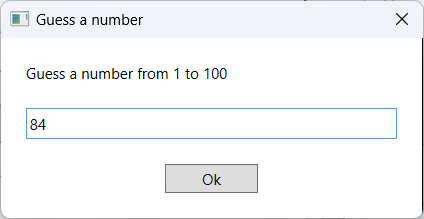
Ta tiến hành nhập dữ liệu cho Dialog Title, Input Label và Value entered như dưới đây:
- Dialog Title: “Guess a number”
- Input Label: “Guess a number from 1 to 100”
- Value entered:InitialGuess, có nhiệm vụ lưu lại giá trị mà người chơi đoán
Xem hình minh họa kết quả:
Sau đó ta quay lại màn hình chính, bằng cáhc bấm vào link “State machine” ở góc trái bên trên màn hình, cùng dòng với Expand All và Collapse All, kết quả :
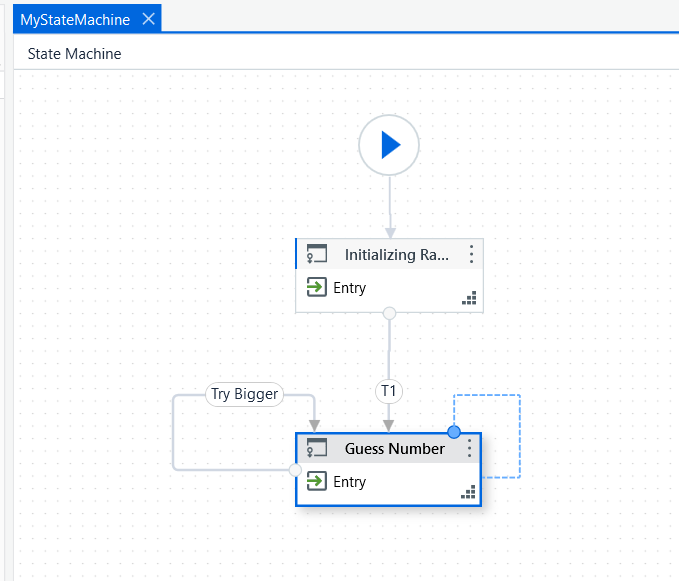
Bước 8: Tạo Transition “Try Bigger”
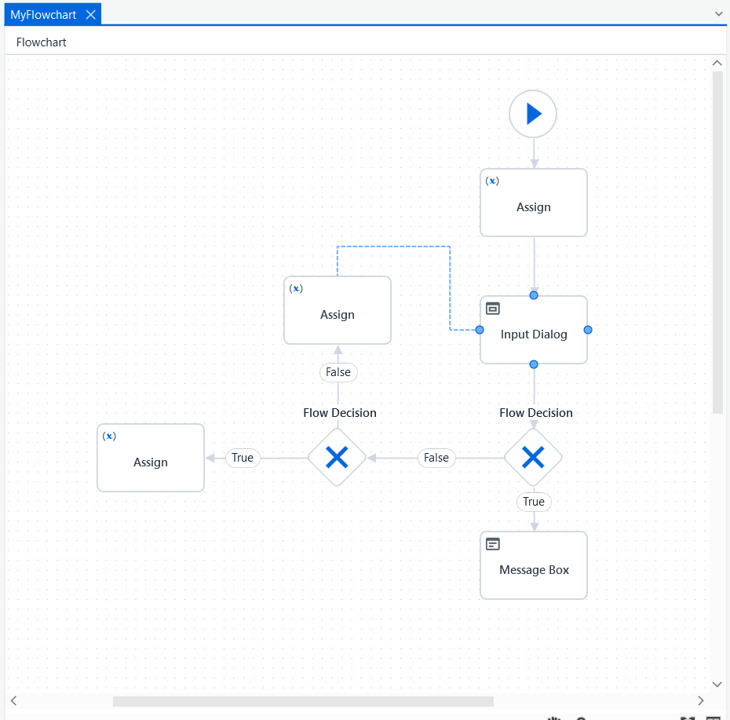
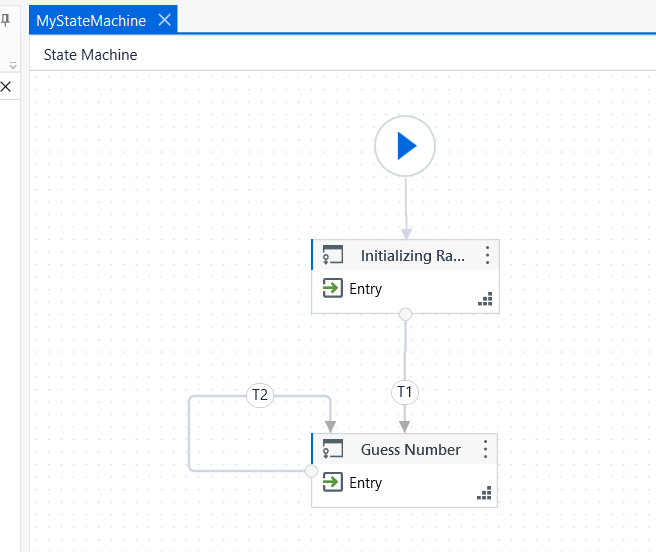
Click chuột vào đường viền của State Guess Number, sau đó giữ và di chuyển chuột vào vị trí khác của chính State này để tạo transition, lúc kéo bạn sẽ thấy đường nét đứt như hình dưới đây:

Sau đó bạn nhả chuột ra, kết quả:
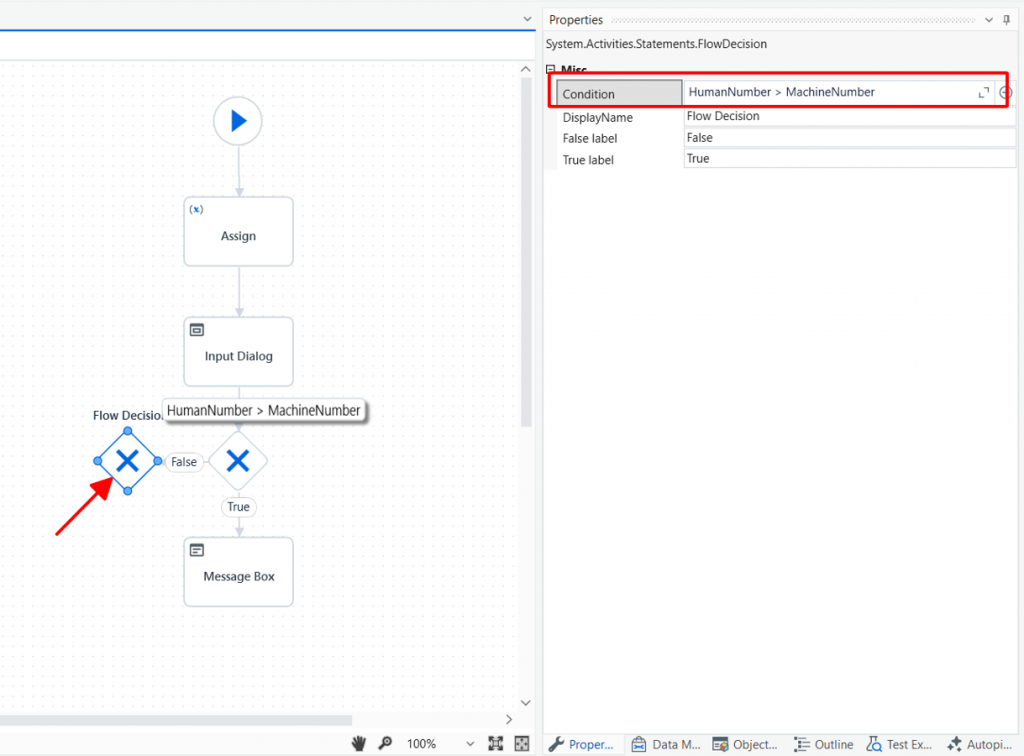
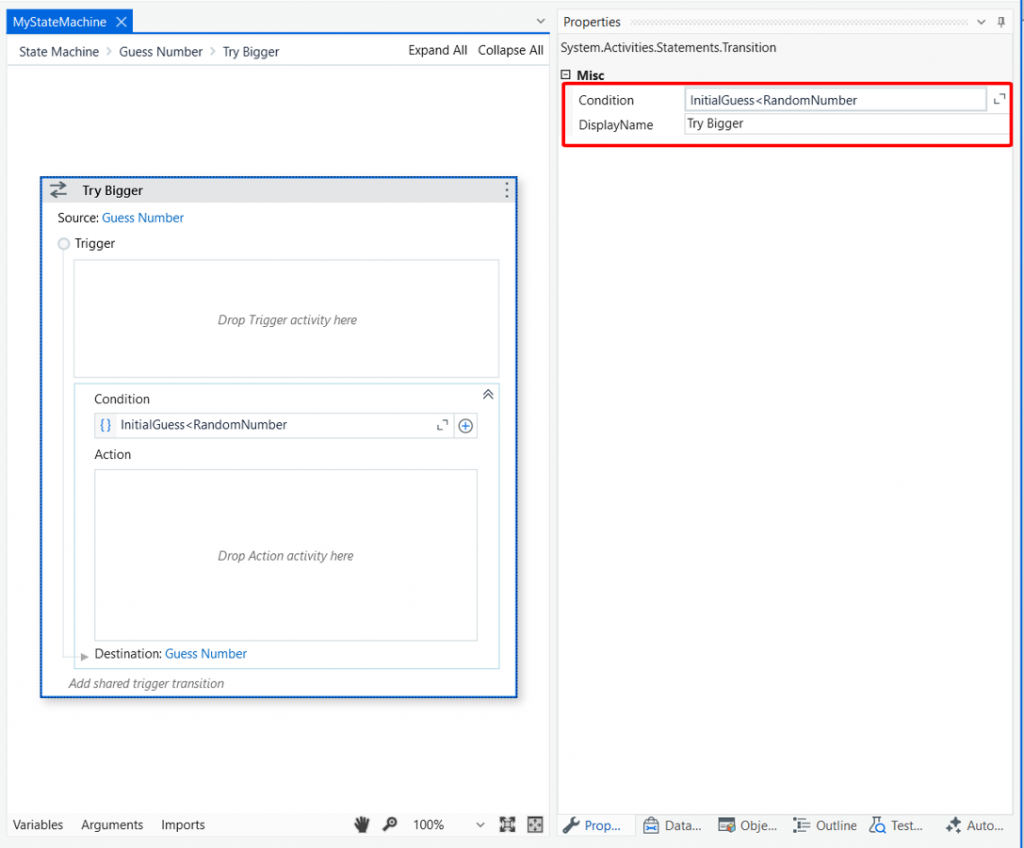
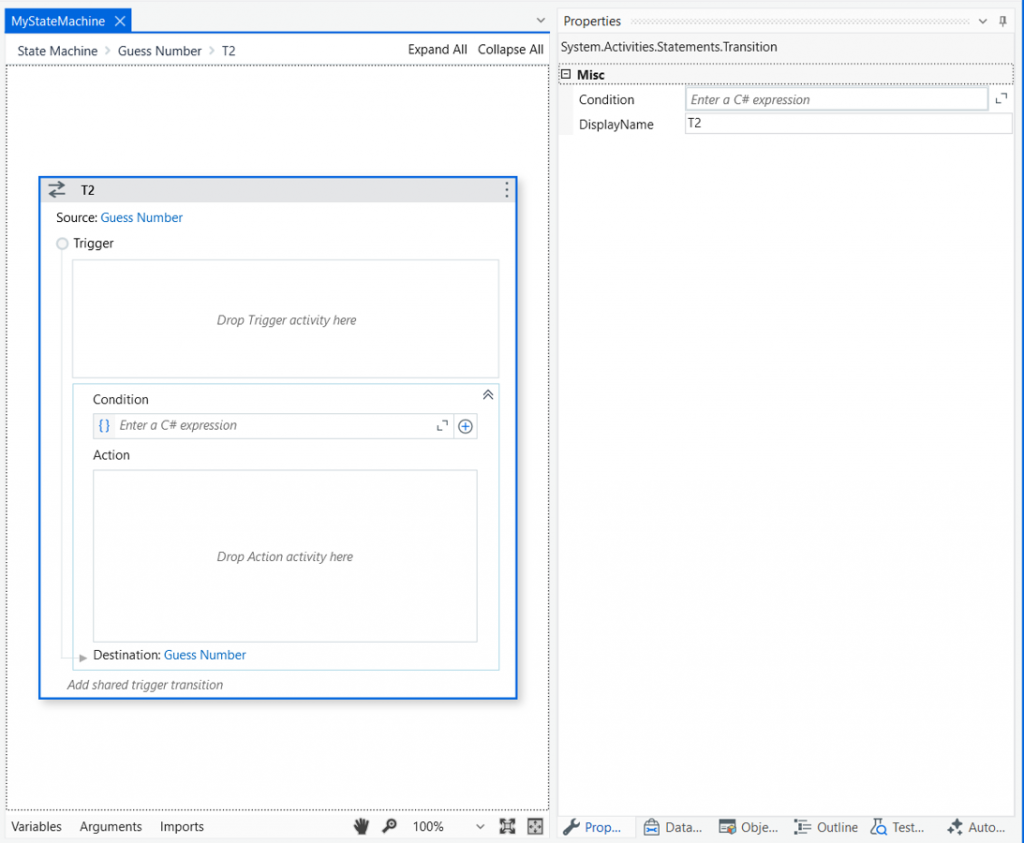
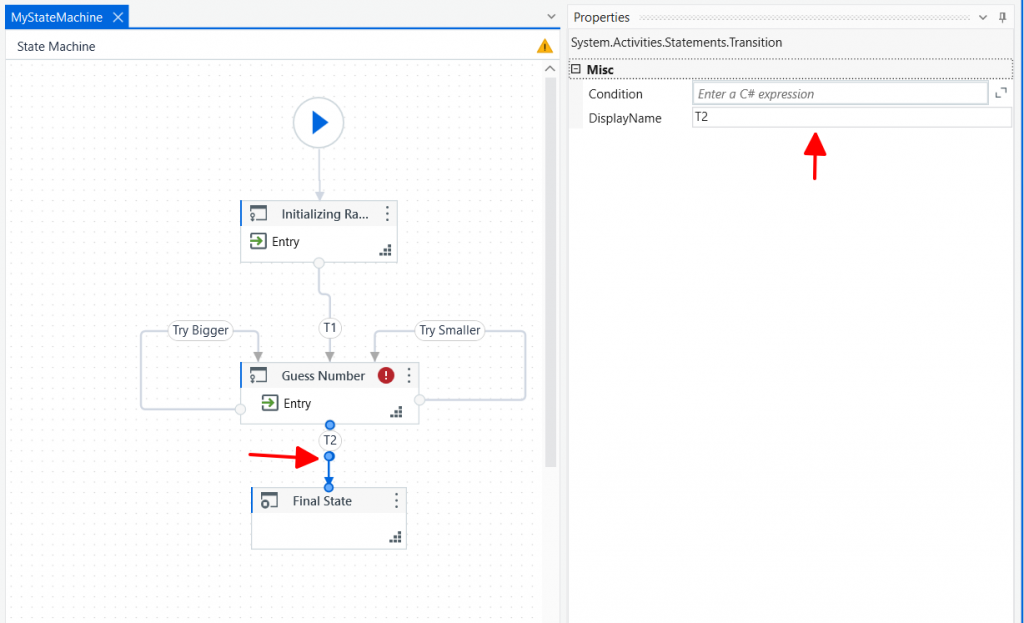
Ta Double Click vào Transition này (T2), giao diện chi tiết của Transition hiện thị ra như hình dưới đây:

- DisplayName: “Try Bigger”
- Condition: InitialGuess<RandomNumber
Xem hình kết quả:
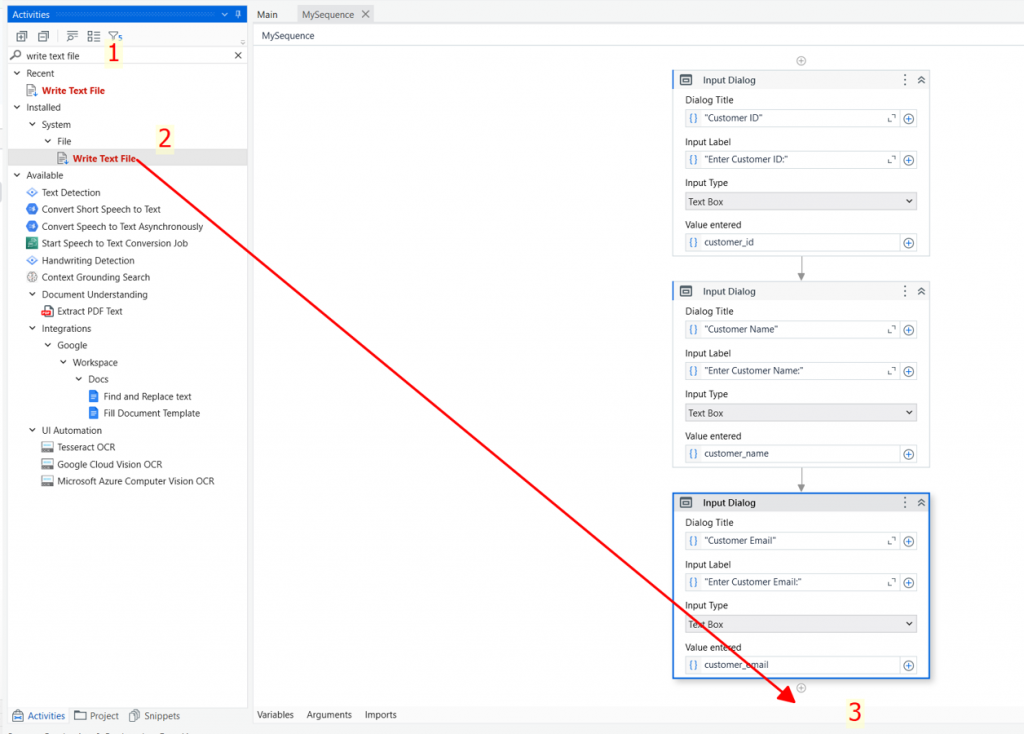
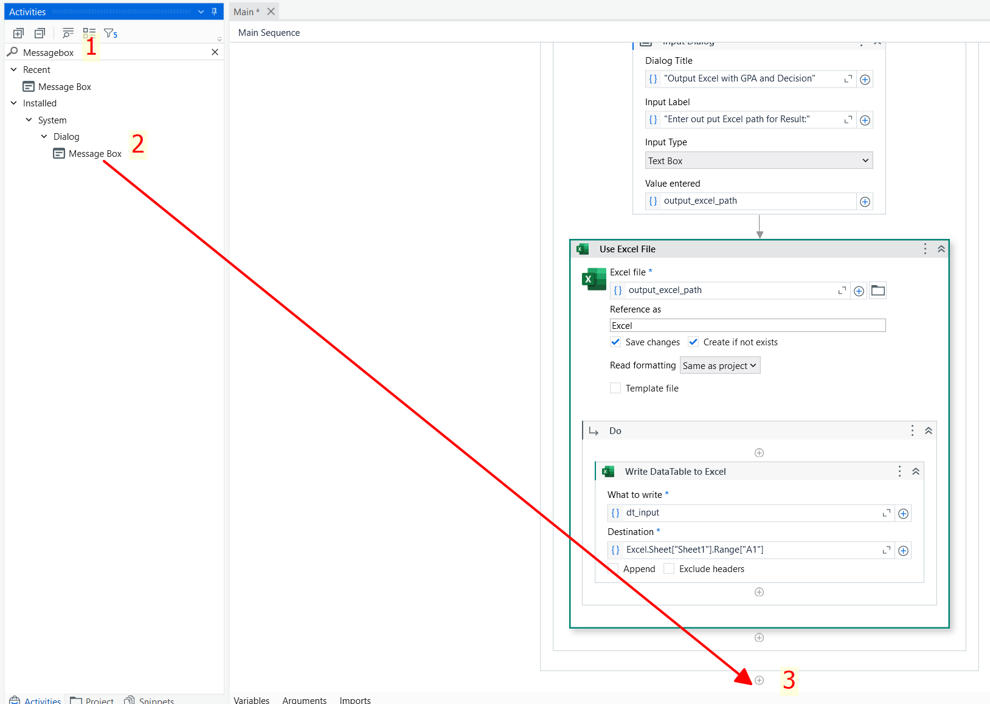
Bước 9: Kéo thả MessageBox Activity vào mục Action của Try Bigger:
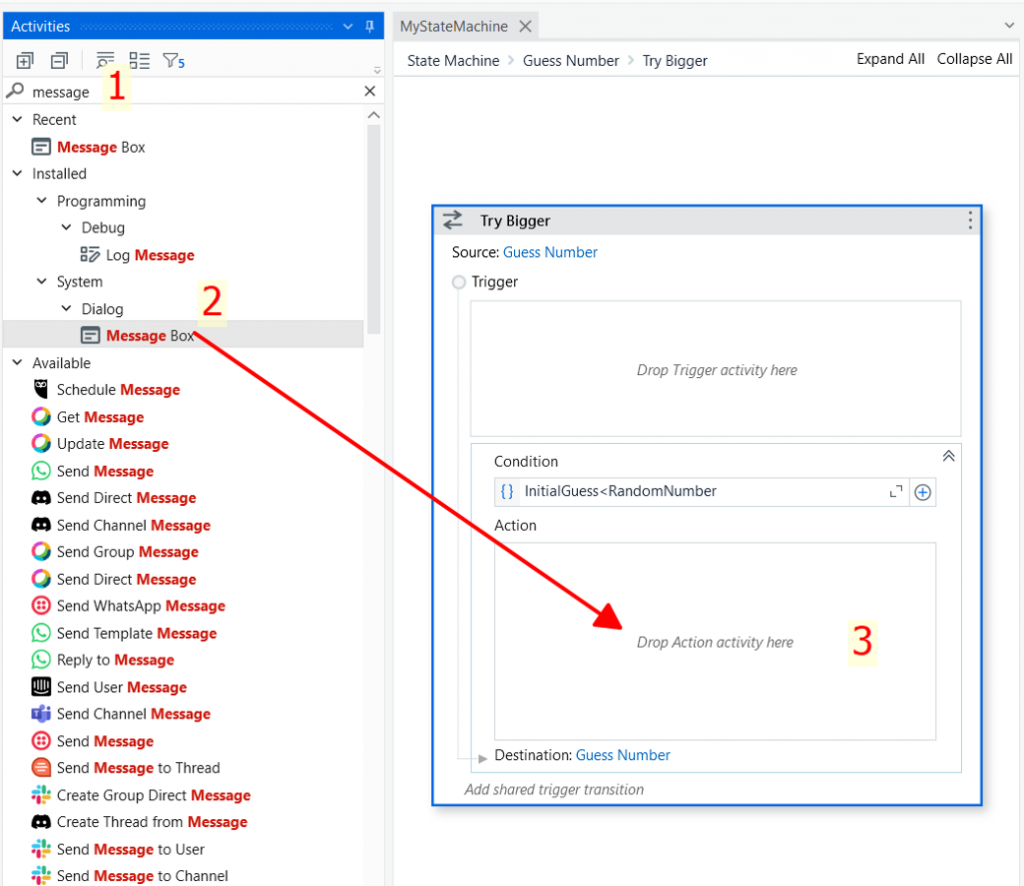
Trong thẻ Activities, ta gõ từ khóa Message và kéo MessageBox Activity vào giao diện Transition của Try Bigger như hình trên, kết quả:

Thuộc tính Text của Message Box ta nhập: “Your guess is too small. Try a bigger number.”, kết quả:
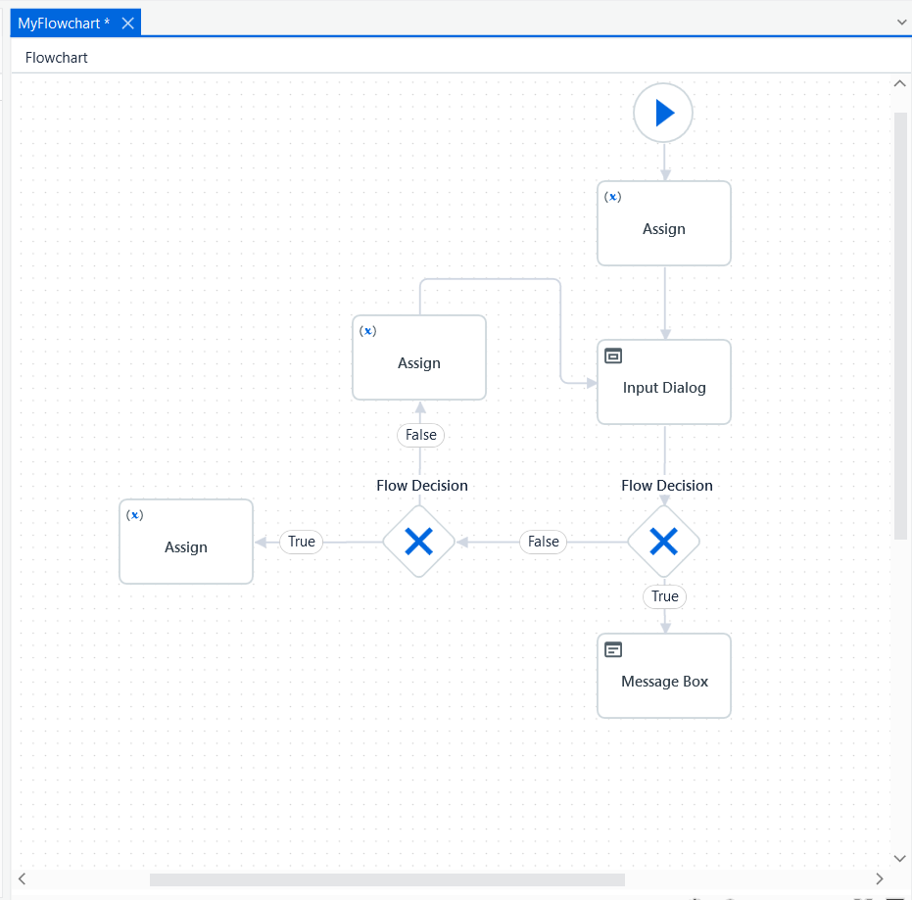
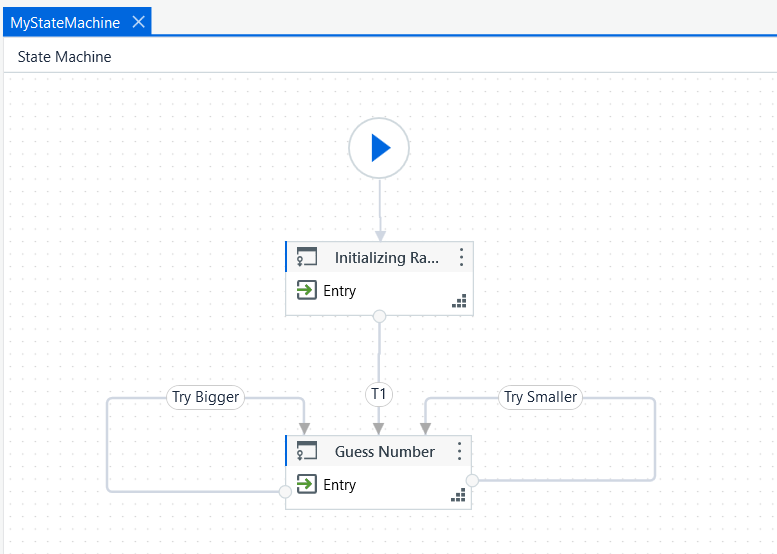
Quay trở về màn hình chính State Machine ban đầu, ta có:
Bước 10: Tạo Transition “Try Smaller”:
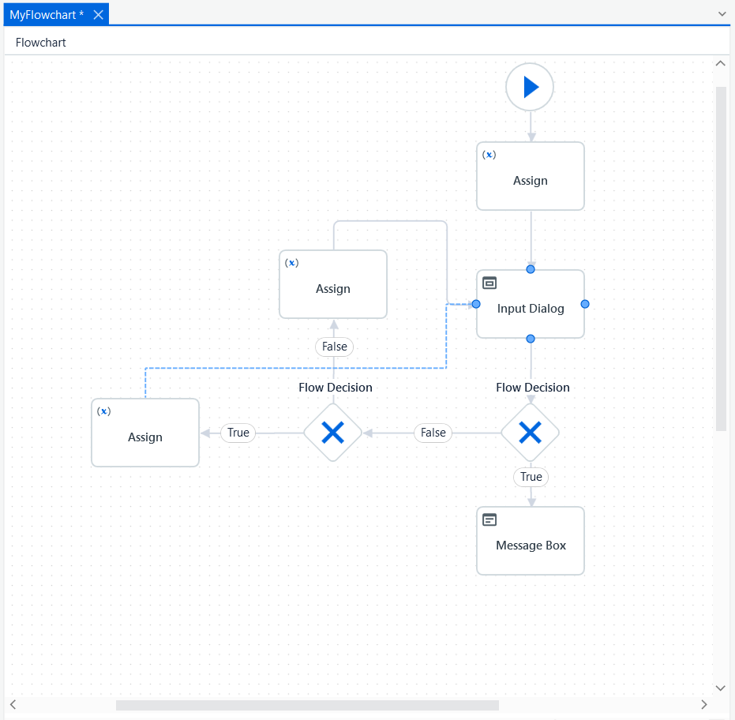
Click chuột vào đường viền của State Guess Number, sau đó giữ và di chuyển chuột vào vị trí khác của chính State này để tạo transition, lúc kéo bạn sẽ thấy đường nét đứt như hình dưới đây:
Sau đó bạn nhả chuột ra, kết quả:
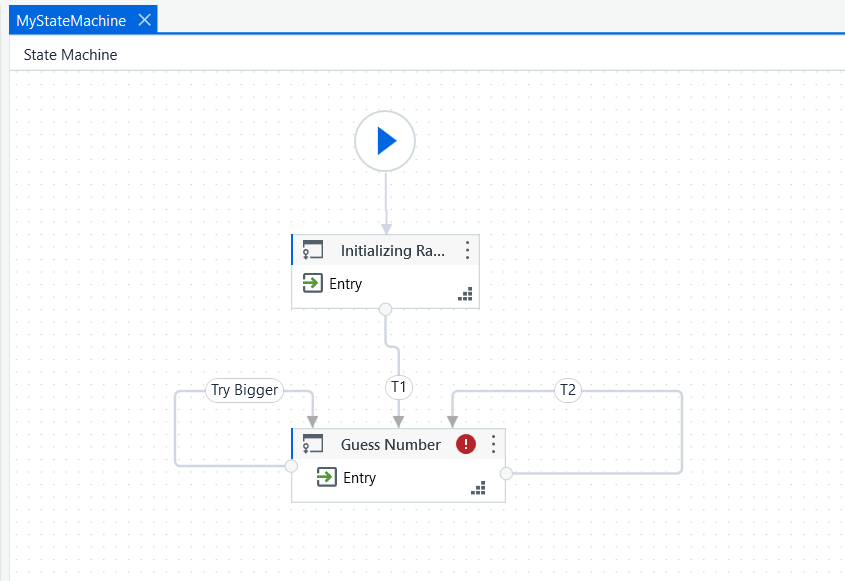
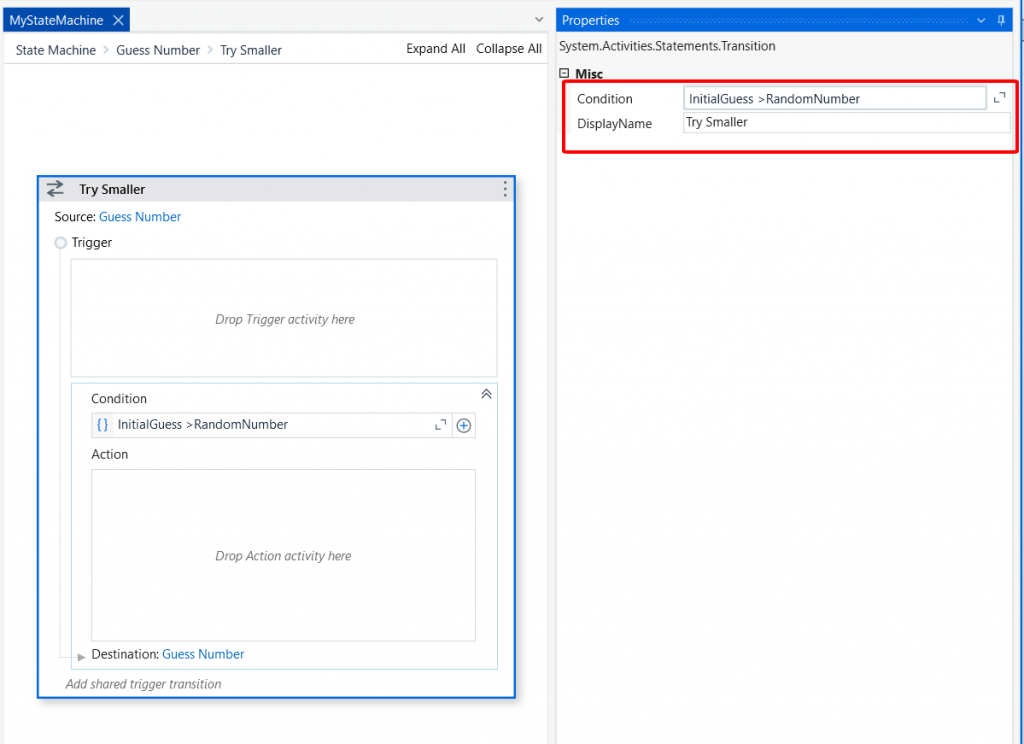
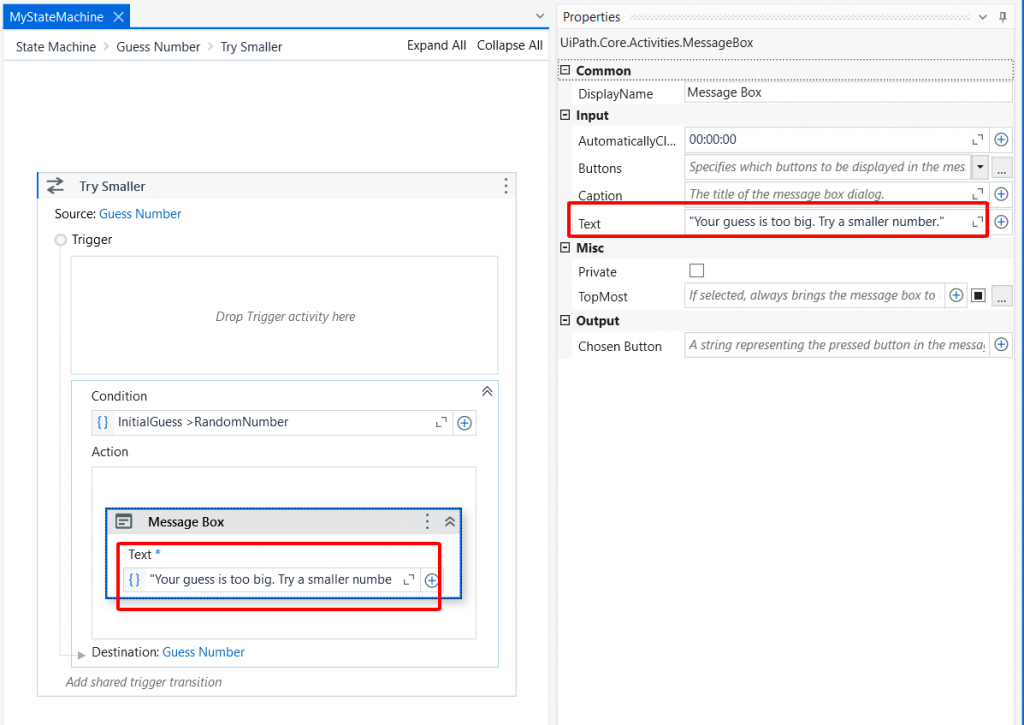
Ta Double Click vào Transition này (T2), giao diện chi tiết của Transition hiện thị ra như hình dưới đây:
- DisplayName: “Try Smaller”
- Condition: InitialGuess >RandomNumber
Xem hình kết quả:
Bước 11: Kéo thả MessageBox Activity vào mục Action của Try Smaller:
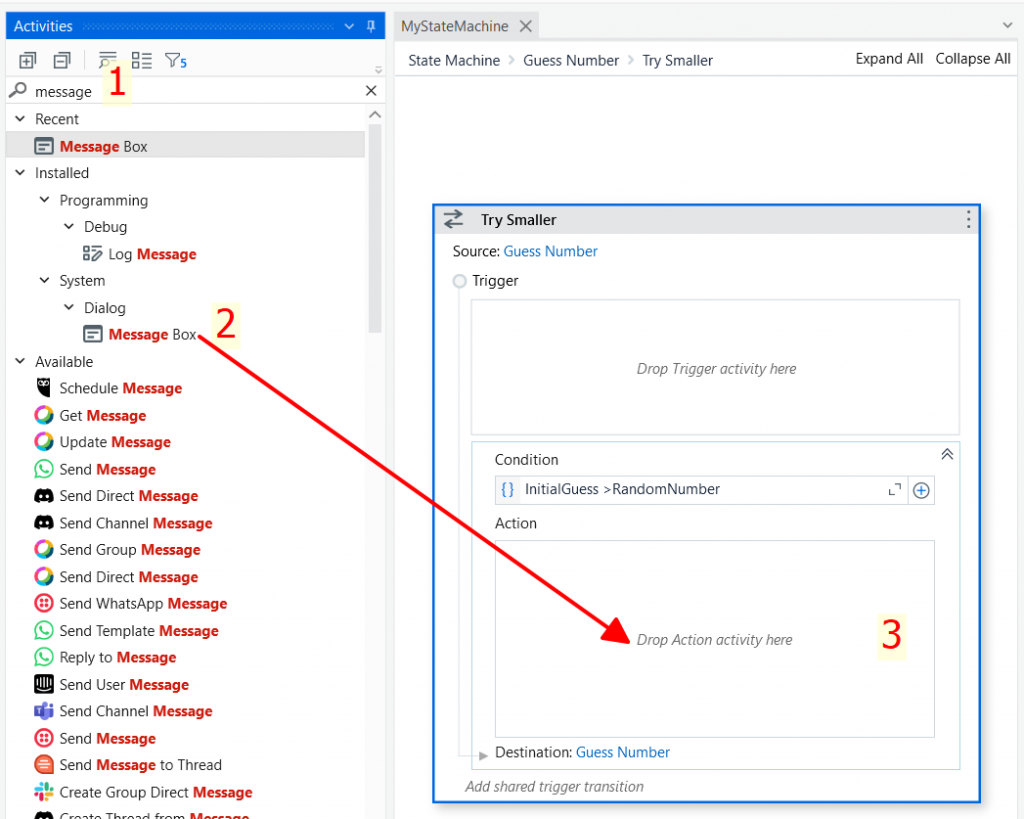
Trong thẻ Activities, ta gõ từ khóa Message và kéo MessageBox Activity vào giao diện Transition của Try Smaller như hình trên, kết quả:
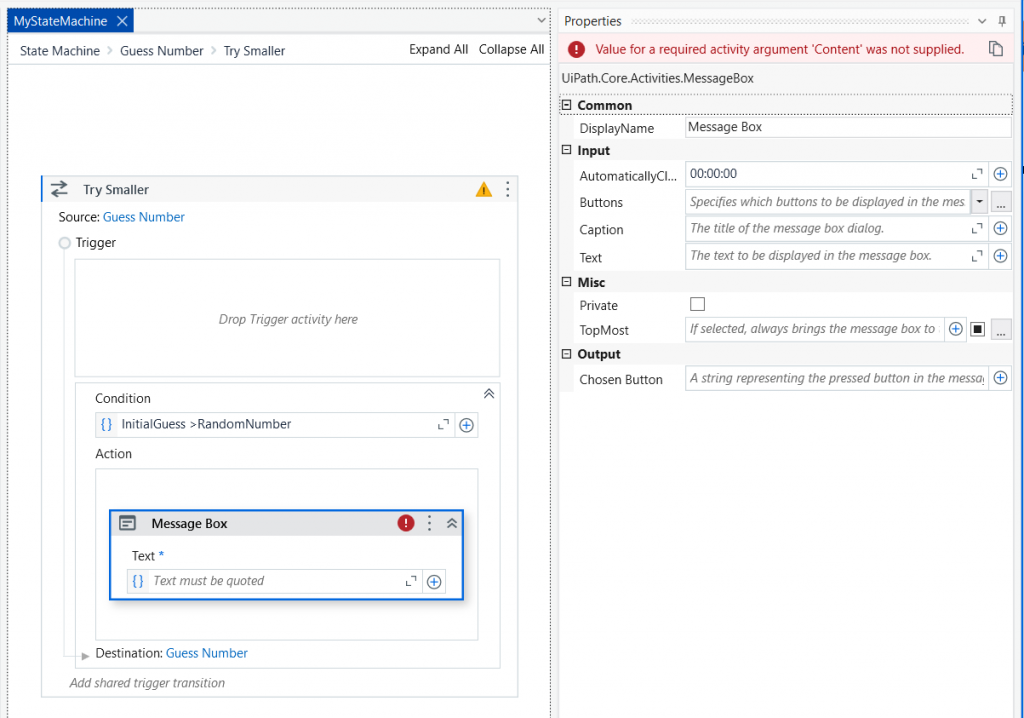
Thuộc tính Text của Message Box ta nhập: “Your guess is too big. Try a smaller number.”, kết quả:
Quay trở về màn hình chính State Machine ban đầu, ta có:
Bước 12: Kéo Final State và kết nối vào Guess Number State
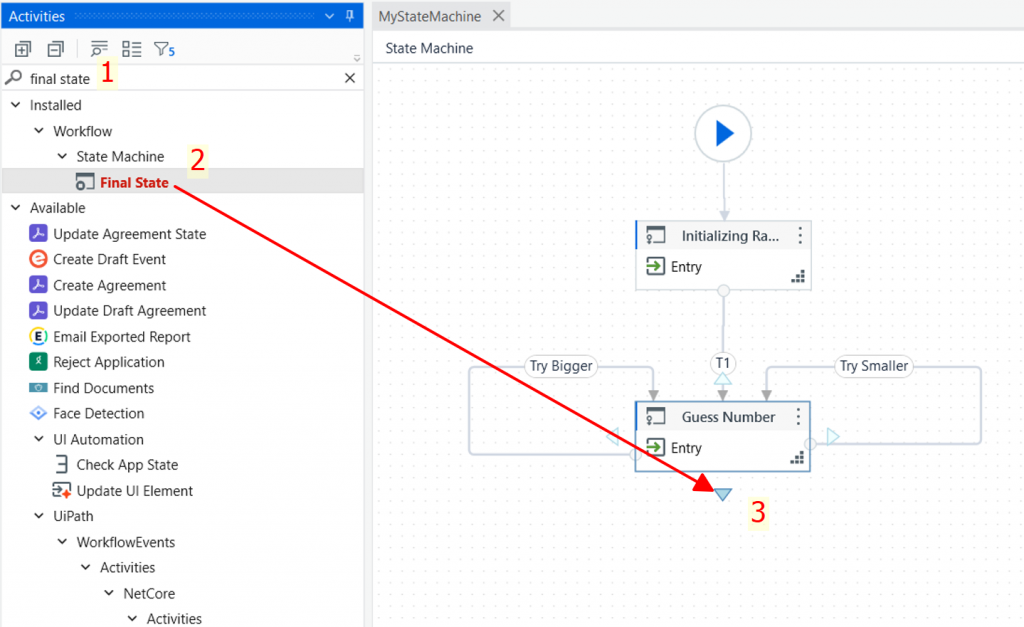
Trong thẻ Activities, ta gõ từ khóa Final state sau đó kéo thả Activity này vào màn hình và kết nối nó với Guess Number như minh họa, kết quả:
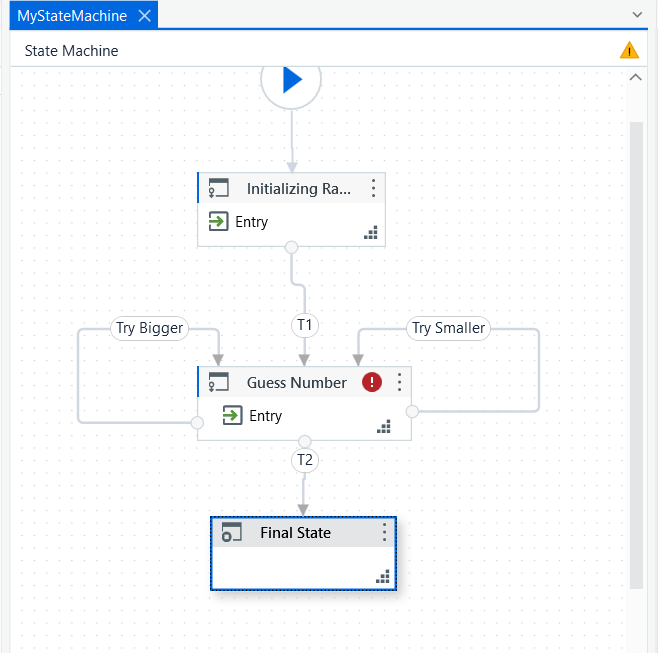
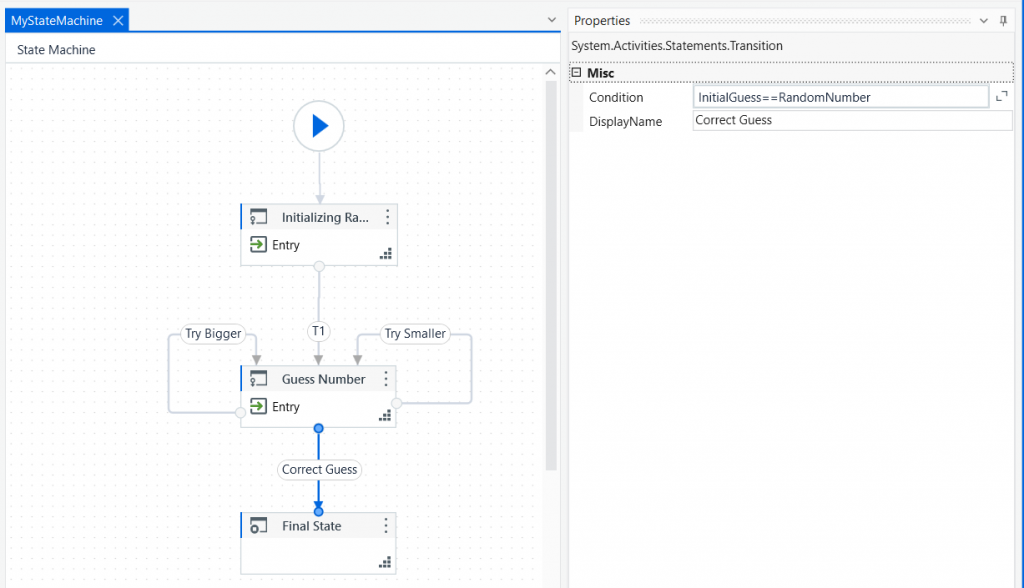
Ta nhấn vào T2 để hiển thị Property:
- Condition: InitialGuess==RandomNumber
- DisplayName:Correct Guess
Kết quả:
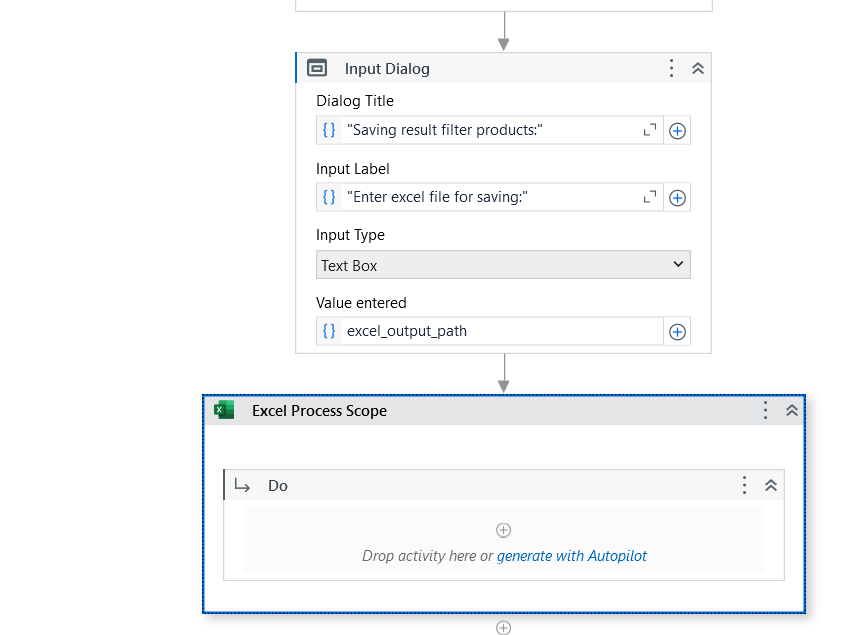
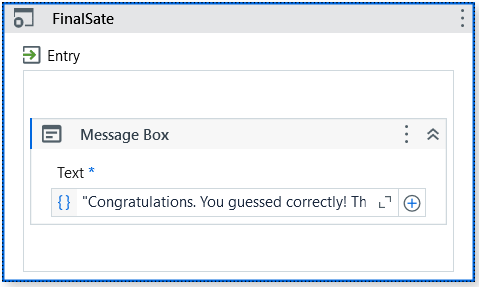
Bước 13: Kéo MessageBox vào Entry của Final State
Ta Double-click vào Final State để mở màn hình chi tiết của Final State
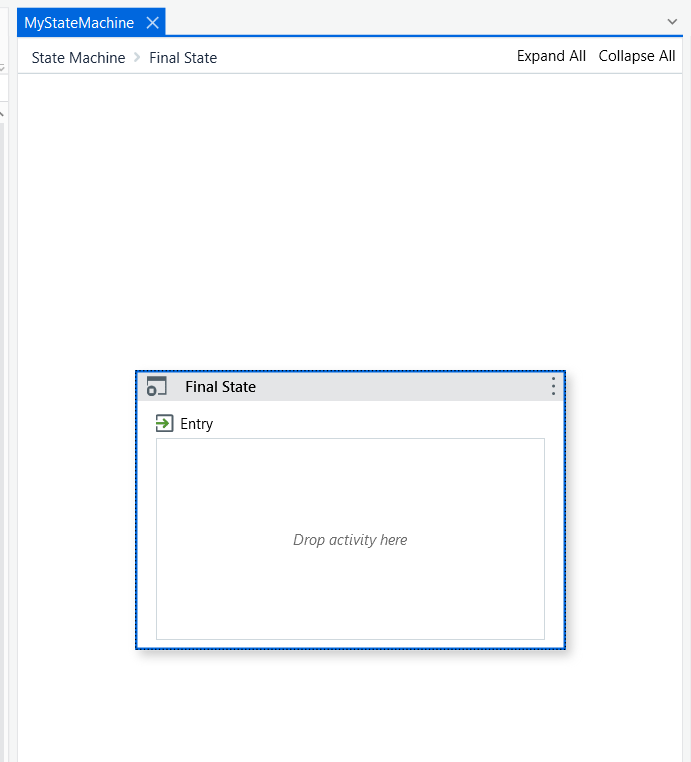
Sau đó kéo thả MessageBox Activity vào Entry:
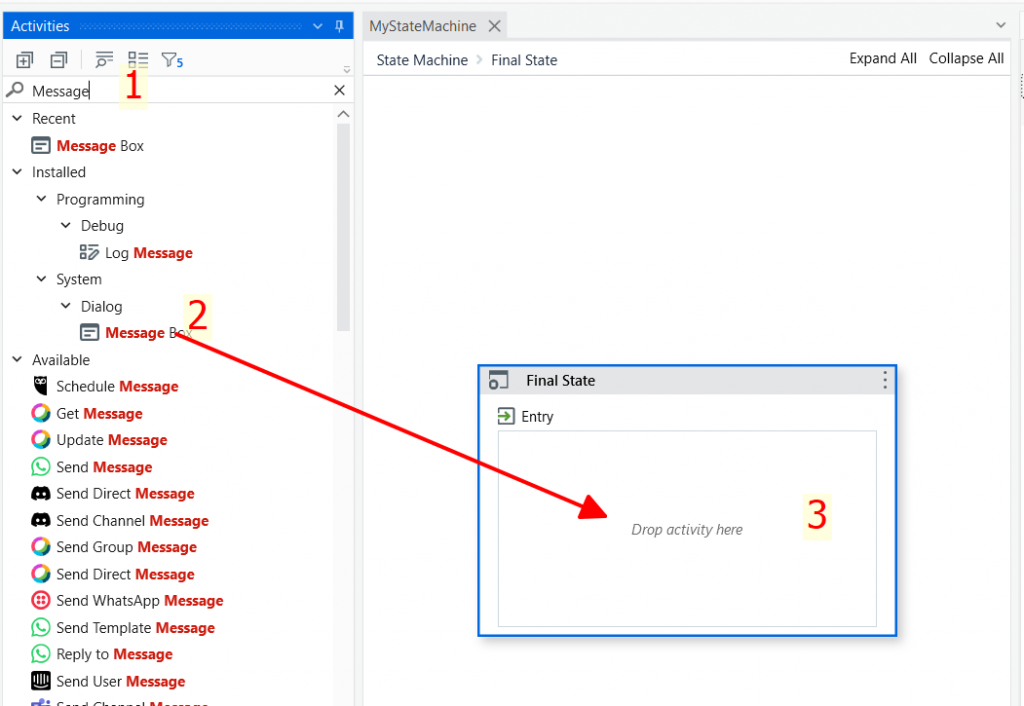
Trong thẻ Activities ta gõ từ khóa Message rồi kéo thả MessageBox Activity vào Entry của Final State, kết quả:
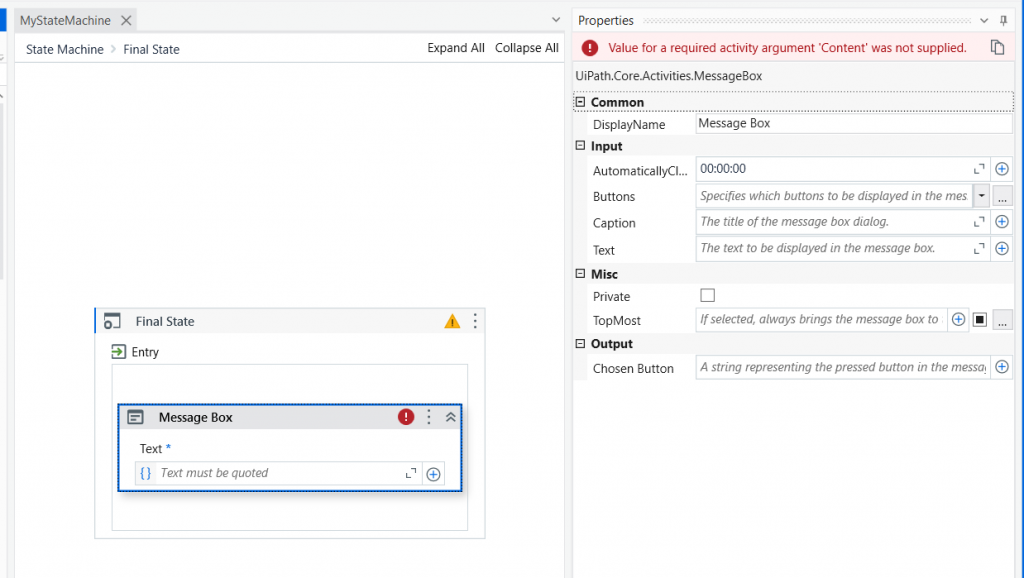
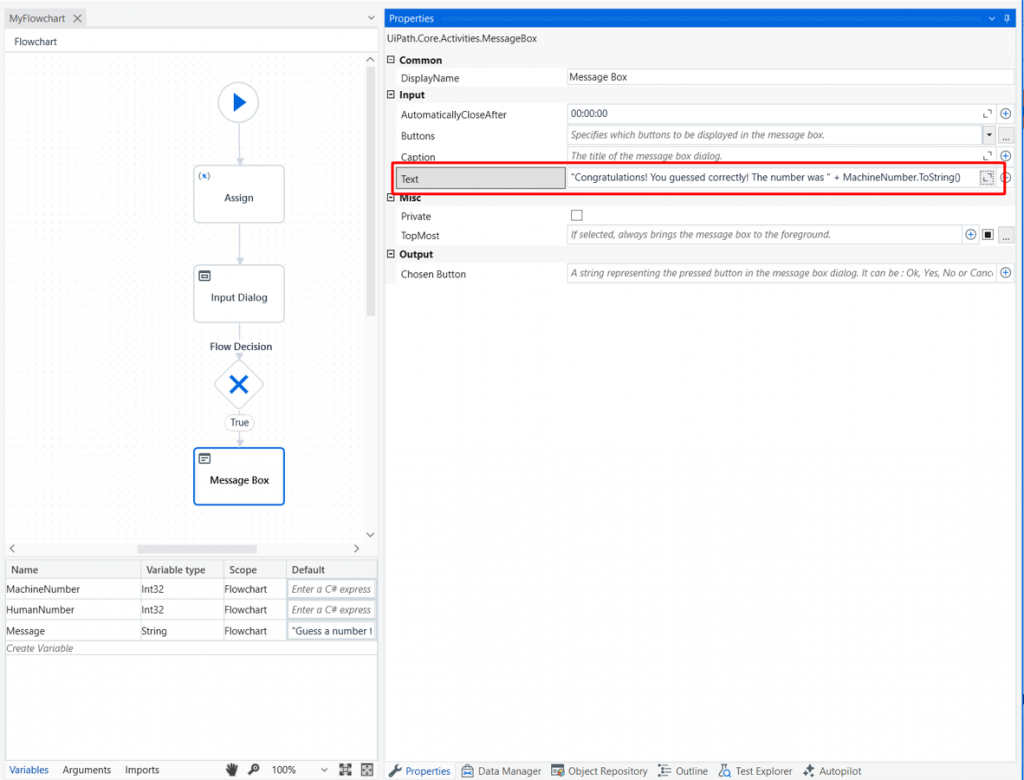
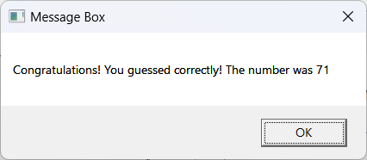
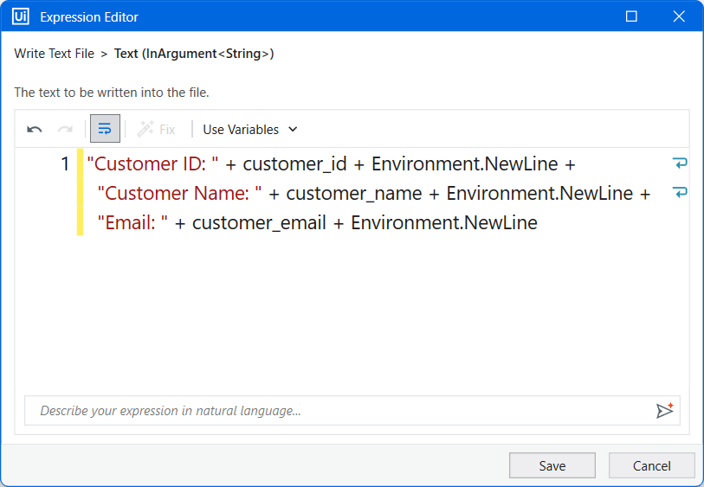
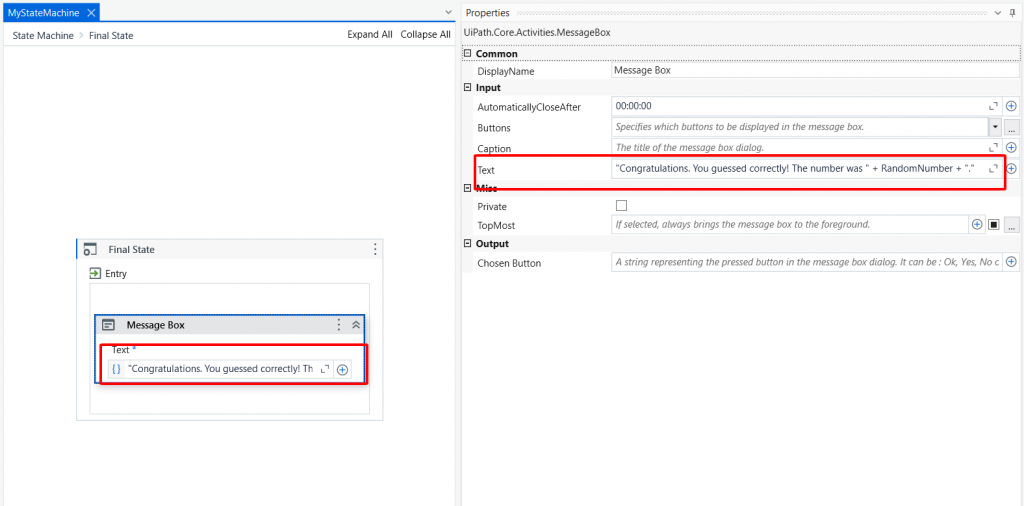
Trong thuộc tính Text của MessageBox ta nhập: “Congratulations. You guessed correctly! The number was ” + RandomNumber + “.”, kết quả:
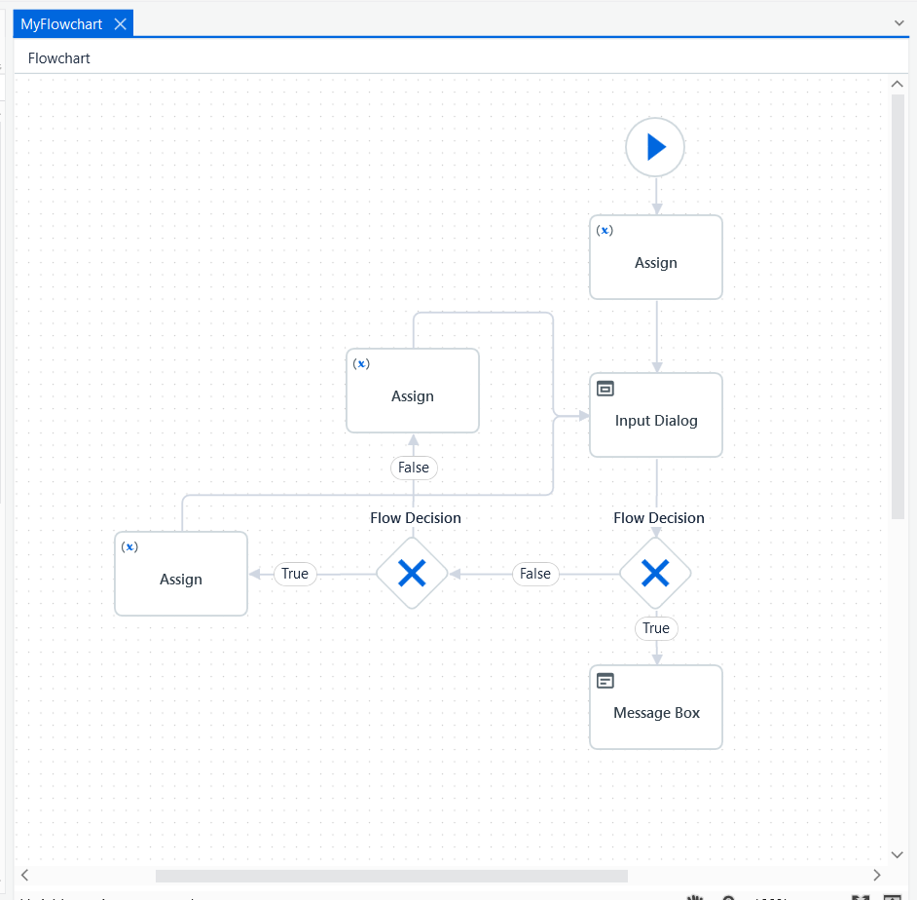
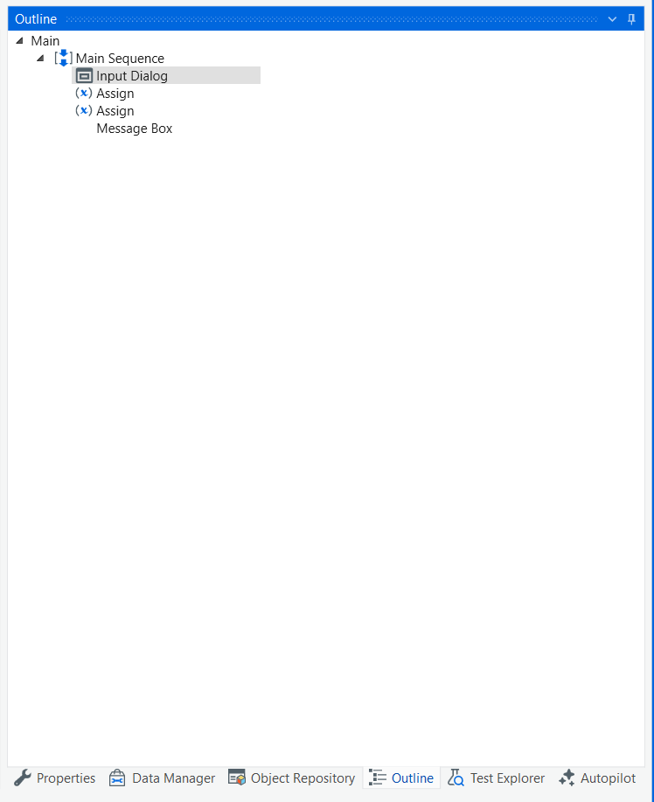
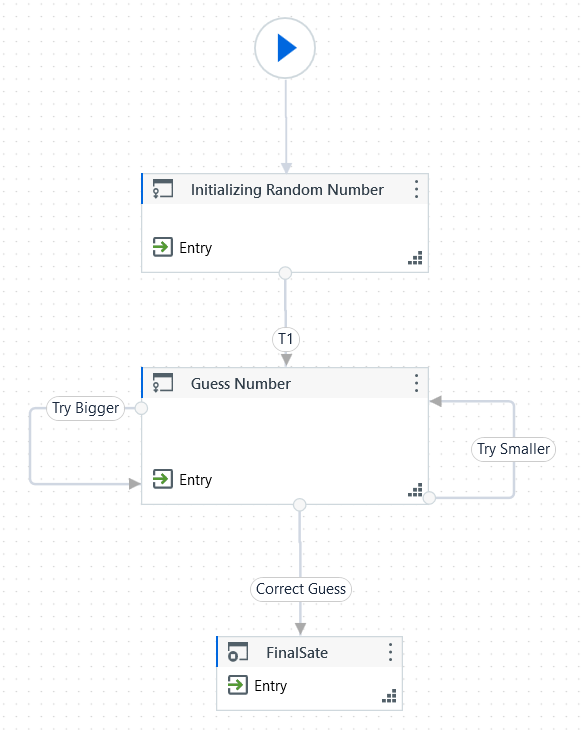
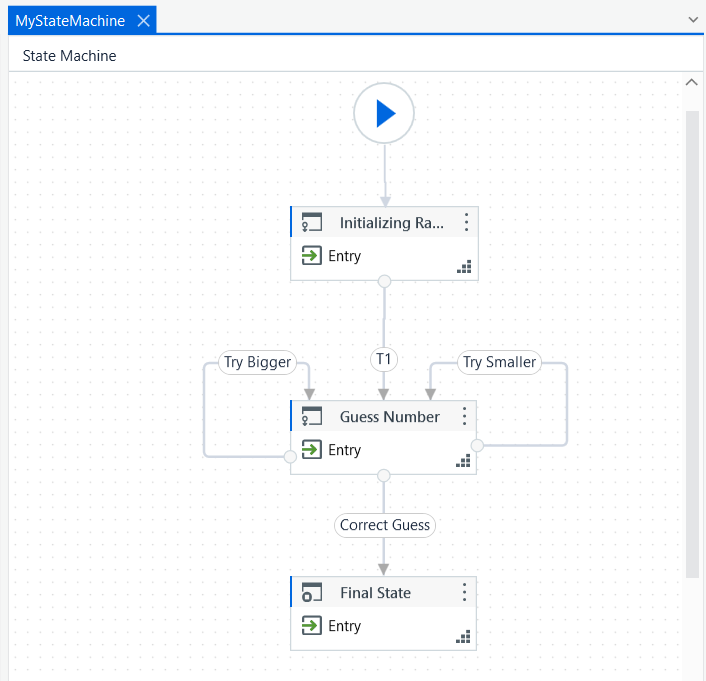
Quay trở về State Machine ta có quy trình tổng quan của State Machine này như sau:
Tiến hành chạy chương trình tự động hóa State Machine này ta có kết quả như sau:
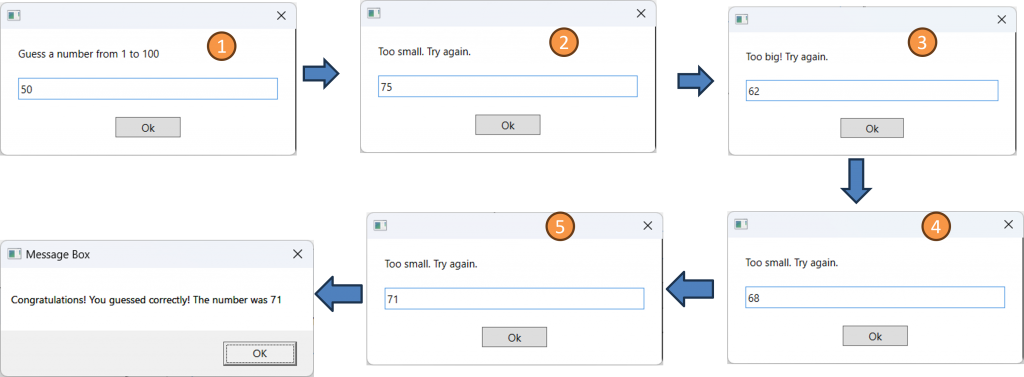
Thực thi phần mềm tự động hóa Game đoán số nhị phân này ta có kết quả như sau (các bạn làm theo nhé, và lưu ý là tùy thuộc vào mỗi máy tính, mỗi lần chạy mà nó sẽ khác nhau, nhưng bạn cần tuân thủ theo Game Nhị phân, tức là mỗi lần đoán sai thì giảm quy mô bài toán đi 1/2), chạy Game ta có:
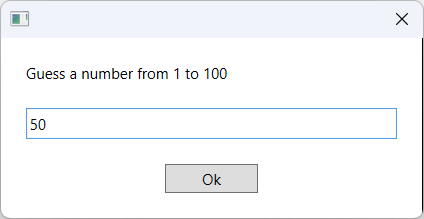
Máy ra 1 số ngẫu nhiên từ 1 tới 100, ta đoán 50 theo cơ chế nhị phân
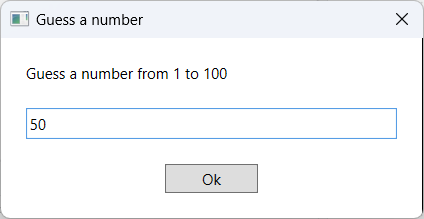
Nhấn OK, kết quả:

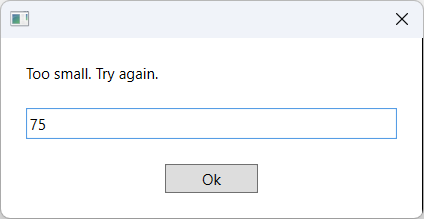
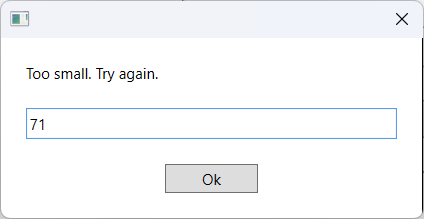
Chương trình báo rằng số ta đoán quá nhỏ, cần đoán số lớn hơn, tiếp tục áp dụng cơ chế nhị phân ta sẽ đoán số 75:

Nhấn OK, kết quả:
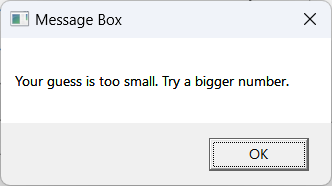
Chương trình báo ta đoán số quá nhỏ, cần đoán số lớn hơn, tiếp tục áp dụng cơ chế nhị phân ta sẽ đoán số 87:
Nhấn Ok, kết quả:
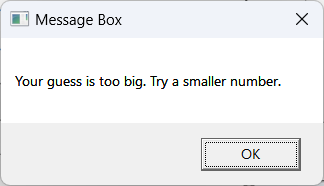
Chương trình báo ta đoán số quá lớn, cần đoán số nhỏ hơn, tiếp tục áp dụng cơ chế nhị phân ta sẽ đoán số 81:

Nhấn Ok, kết quả:
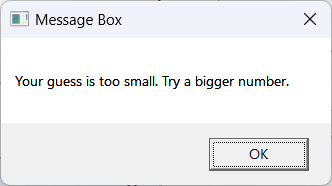
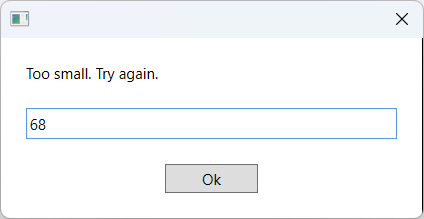
Chương trình báo ta đoán số quá nhỏ, cần đoán số lớn hơn, tiếp tục áp dụng cơ chế nhị phân ta sẽ đoán số 84:
Nhấn Ok, kết quả:
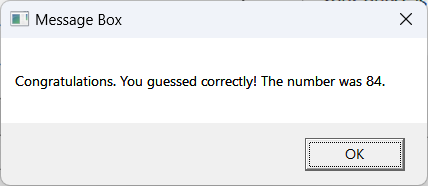
Như vậy sau 5 lần đoán ta đã đoán thành công, đây chính là cách ứng dụng State Machine để xử lý cho bài Game đoán số nhị phân, ở bài trước là sử dụng FlowChart.
Bạn làm theo cơ chế nhị phân ở trên thì sẽ đoán trúng được, thường nếu theo cơ chế này thì khoảng tối đa 7 lần là ta đoán trúng bất chấp quy mô của bài toán.
Bạn có thể tải full source code dự án tự động hóa này ở đây:
https://www.mediafire.com/file/cx5y7jst8fvj5q3/LearnStateMachine.rar/file
Như vậy Tui đã hướng dẫn xong các bạn cách sử dụng State Machine để tạo tự động hóa dạng Máy chuyển trạng thái qua bài minh họa Game nhị phân
Bài học tiếp theo, Tui sẽ hướng dẫn các bài tập bổ sung liên quan tới tạo quy trình tự động hóa, tạo thư viện, Sequence, Flowchart và State machine, Các bạn chú ý theo dõi
Chúc các bạn thành công
p/s: Toàn bộ các bài học liên quan tới Tự động hóa quy trình bằng Robot được tổng hợp tại link https://tranduythanh.com/robotic-process-automation/, các bạn vào trang này và kéo xuống có thể theo dõi từng bài theo chươngĐăng ký và tải phần mềm UiPath Studio