Bài học này Tui trình bày chi tiết về đối tượng PlotWidget được đề cập trong PyQtGraph Part 1 mà ta đã dùng để vẽ một Chart đơn giản.
Việc nắm được ý nghĩa và các kỹ thuật sử dụng các phương thức của đối tượng PlotWidget sẽ giúp chúng ta dễ dàng hiệu chỉnh Chart theo nhu cầu:
- Thiết lập tiêu đề cho Chart
- Thiết lập tiêu đề cho các Trục
- Thiết lập màu nền cho Chart
- Thiết lập Background Grid
- Thiết lập màu, độ rộng và kiểu dáng của đường kẻ
- Thiết lập Line Markers
- Thiết lập Legends
- Thiết lập giới hạn các trục
- Thiết lập multiple plot trong một Chart
- Xóa và cập nhật Plot
Tui tóm tắt sơ lược ý nghĩa chức năng của một số phương thức của PlotWidget
| Phương thức | Ý nghĩa chức năng |
|---|---|
| setTitle(title) | Thiết lập tiêu đề cho Chart Ví dụ: self.graphWidget.setTitle(“My Chart Title”) |
| setTitle(title, color, size) | Thiết lập tiêu đề cho Chart cùng với định dạng màu chữ và cỡ chữ. Ví dụ: self.graphWidget.setTitle(“My Chart Title”, color=”b”, size=”30pt”) |
| setLabel(position,text) | Thiết lập tiêu đề cho các trục. position có 4 giá trị: ‘left,’right’,’top’,’bottom’ Ví dụ: styles = {‘color’:’r’, ‘font-size’:’30pt’} self.graphWidget.setLabel(‘left’, ‘Temperature (°C)’, **styles) self.graphWidget.setLabel(‘bottom’, ‘Hour (H)’, **styles) |
| setBackground(background) | Phương thức này dùng để thiết lập màu nền cho Chart. Ví dụ: import pyqtgraph as pg self.graphWidget=pg.PlotWidget() self.graphWidget.setBackground(“y”) |
| showGrid(x=True, y=True) | Hiển thị lưới cho Chart |
| plot(X value, Y value, name=”Plot 1″, pen=pen, symbol=”+”, symbolSize=30, symbolBrush=(“b”), ) | Hàm để vẽ Chart có sử dụng Pen để định dạng đường vẽ như màu đường kẻ, kiểu đường kẻ, độ dày đường kẻ, biểu tượng. Ví dụ: pen = pg.mkPen(color=(255, 0, 0)) self.graphWidget.plot(hour, temperature, pen=pen) |
| addLegend() | Hàm hiển thị Legend cho Chart |
| setXRange(5, 20, padding=0) | Thiết lập giới hạn cho trục X |
| setYRange(30, 40, padding=0) | Thiết lập giới hạn cho trục Y |
| clear() | Xóa các plot trên Chart |
| data_line= graphWidget.plot(x, y) data_line.setData(new x, new y) | Cập nhật dữ liệu cho Plot |
Tui trình bày chi tiết các chức năng dưới này, vừa kết hợp lý thuyết và thực hành, các bạn nhớ thực hiện theo.
Tạo dự án “LearnPyQtGraphPart2” thiết kế giao diện và dữ liệu mẫu giống như bài trước. Bạn có thể copy y chang toàn bộ các file .py, .ui của bài trước vào “LearnPyQtGraphPart2” để sử dụng luôn
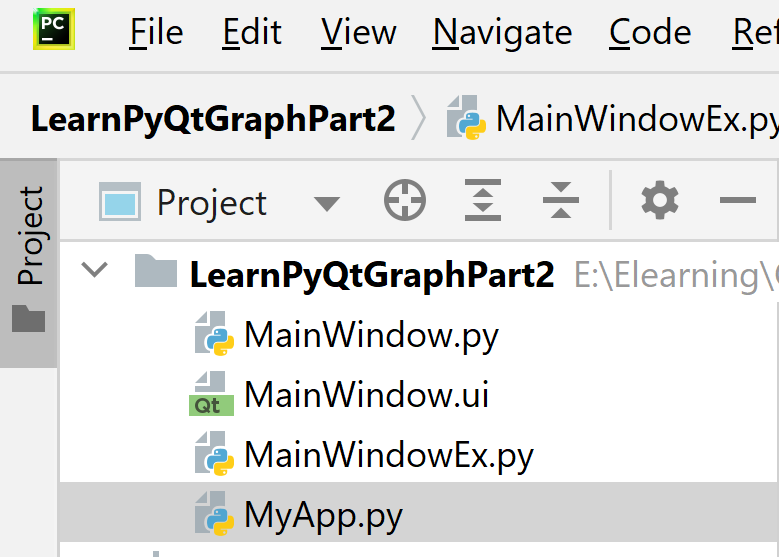
- “MainWindow.ui” là giao diện được thiết kế bằng Qt Designer
- “MainWindow.py” là generate python code của “MainWindow.ui”
- “MainWindowEx.py” là file mã lệnh kế thừa từ “MainWindow.py” để xử lý nạp giao diện, gán Chart và các sự kiện, lớp này sẽ không lệ thuộc vào sự thay đổi của giao diện cũng như generate code
- “MyApp.py” là file mã lệnh thực thi chương trình
Giao diện “MainWindow.ui” và dữ liệu mẫu trong “MainWidowEx.py” là y chang như bài trước nên Tui không chụp hình lại, các bạn tự chuyển qua. Còn dưới đây Tui sẽ lần lượt hướng dẫn từng chức năng cụ thể, các bạn bổ sung vào “MainWindowEx.py“:
1. Thiết lập tiêu đề cho Chart
Ta thiết lập tiêu đề cho Chart bằng hàm setTitle(title)
self.graphWidget.setTitle("Chart Title Here")Ngoài ra ta có thể định dạng style cho title như màu tiêu đề, cỡ chữ tiêu đề, in đậm, in nghiêng.
| Style | Cách dùng |
|---|---|
| color | ‘CCFF00’ , ‘b’ |
| size | ’10pt’ |
| bold | True/False |
| italic | True/False |
self.graphWidget.setTitle("Temperature per hour", color="b", size="30pt",bold=True,italic=True)Dưới đây là chi tiết mã lệnh của MainWindowEx.py cho phần tiêu đề:
#Step 1: import pyqtgraph
import pyqtgraph as pg
from MainWindow import Ui_MainWindow

class MainWindowEx(Ui_MainWindow):
    def __init__(self):
        super().__init__()
    def setupUi(self, MainWindow):
        super().setupUi(MainWindow)
        self.MainWindow=MainWindow
        #Step 2: call pg.PlotWidget()
        self.graphWidget = pg.PlotWidget()
        #self.graphWidget.setTitle("Temperature per hour")
        #self.graphWidget.setTitle("Temperature per hour", color="b", size="30pt")
        self.graphWidget.setTitle("Temperature per hour", color="b", size="20pt",bold=True,italic=True)
        #Step 3: Create plot data
        hour = [1, 2, 3, 4, 5, 6, 7, 8, 9, 10,11,12]
        temperature = [20, 21, 20, 32, 33, 31, 29,31, 32, 35,37, 45]
        # Step 4: call plot method
        self.graphWidget.plot(hour, temperature)
        #Step 5: add graphWidget into Layout:
        self.myLayout.addWidget(self.graphWidget)
    def show(self):
        self.MainWindow.show()
Chạy “MyApp.py” ta có kết quả:
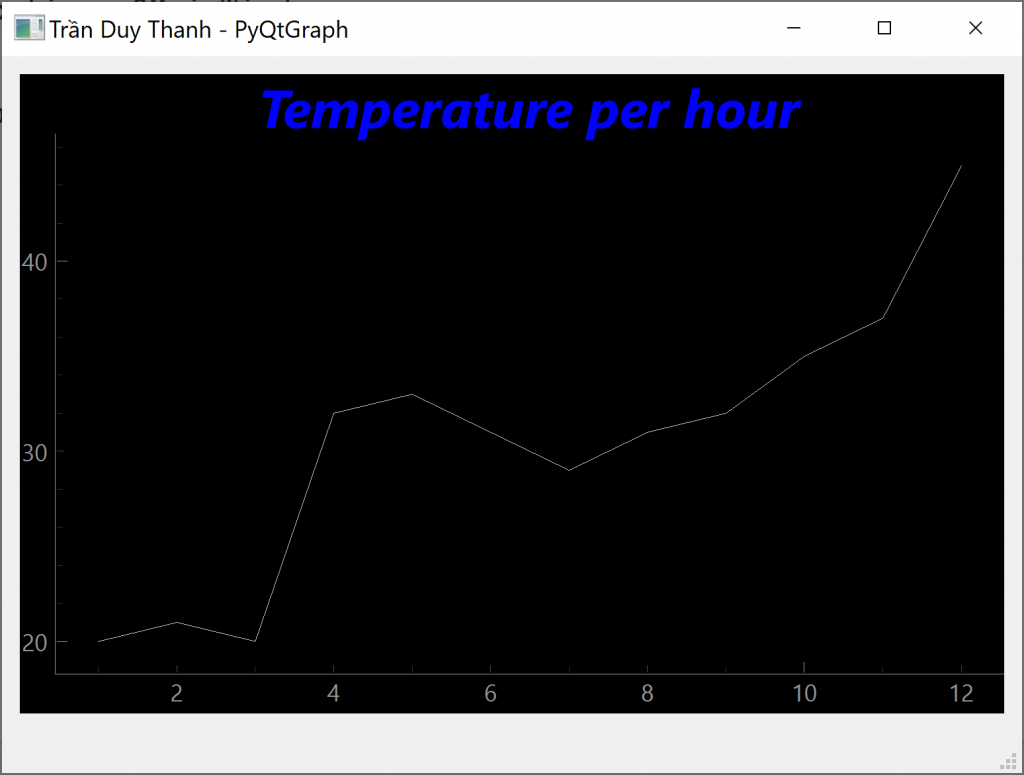
Ngoài ra ta cũng có thể thiết lập title bằng cấu trúc HTML như dưới đây:
self.graphWidget.setTitle("<span style=\"color:blue;font-size:20pt\">Temperature per hour</span>")
2. Thiết lập tiêu đề cho các Trục
Chúng ta dùng hàm setLabel(position,text,style) để thiết lập tiêu đề cho các trục. position có ‘left,’right’,’top’,’bottom’. Ví dụ:
styles = {"color": "#f00", "font-size": "20px"}
self.graphWidget.setLabel("left", "Temperature (°C)", **styles)
self.graphWidget.setLabel("bottom", "Hour (H)", **styles)
Coding đầy đủ của MainWindowEx.py cho phần thiết lập tiêu đề cho các Trục:
#Step 1: import pyqtgraph
import pyqtgraph as pg
from MainWindow import Ui_MainWindow
class MainWindowEx(Ui_MainWindow):
def __init__(self):
super().__init__()
def setupUi(self, MainWindow):
super().setupUi(MainWindow)
self.MainWindow=MainWindow
#Step 2: call pg.PlotWidget()
self.graphWidget = pg.PlotWidget()
#self.graphWidget.setTitle("Temperature per hour")
#self.graphWidget.setTitle("Temperature per hour", color="b", size="30pt")
#self.graphWidget.setTitle("Temperature per hour", color="b", size="20pt",bold=True,italic=True)
self.graphWidget.setTitle("<span style=\"color:blue;font-size:20pt\">Temperature per hour</span>")
styles = {"color": "#f00", "font-size": "20px"}
self.graphWidget.setLabel("left", "Temperature (°C)", **styles)
self.graphWidget.setLabel("bottom", "Hour (H)", **styles)
styles_top_right = {"color": "green", "font-size": "15px"}
self.graphWidget.setLabel("top", "Learn PyQtGraph",**styles_top_right)
self.graphWidget.setLabel("right", "tranduythanh.com",**styles_top_right)
#Step 3: Create plot data
hour = [1, 2, 3, 4, 5, 6, 7, 8, 9, 10,11,12]
temperature = [20, 21, 20, 32, 33, 31, 29,31, 32, 35,37, 45]
# Step 4: call plot method
self.graphWidget.plot(hour, temperature)
#Step 5: add graphWidget into Layout:
self.myLayout.addWidget(self.graphWidget)
def show(self):
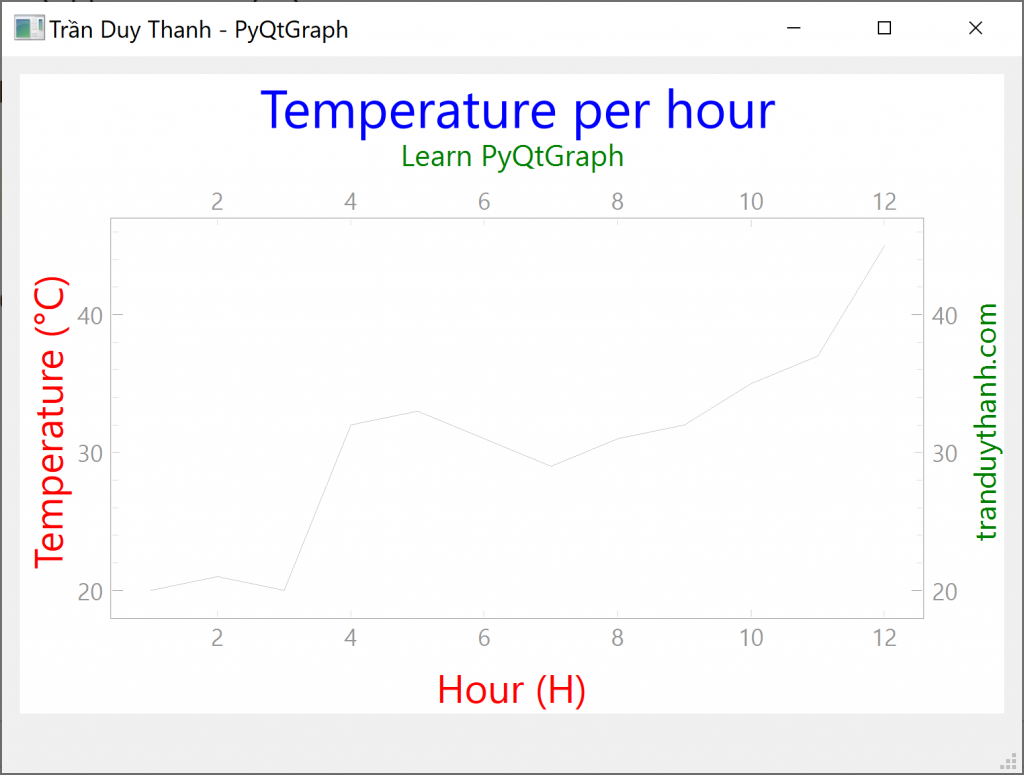
self.MainWindow.show()Chạy “MyApp.py” ta có kết quả như dưới đây:
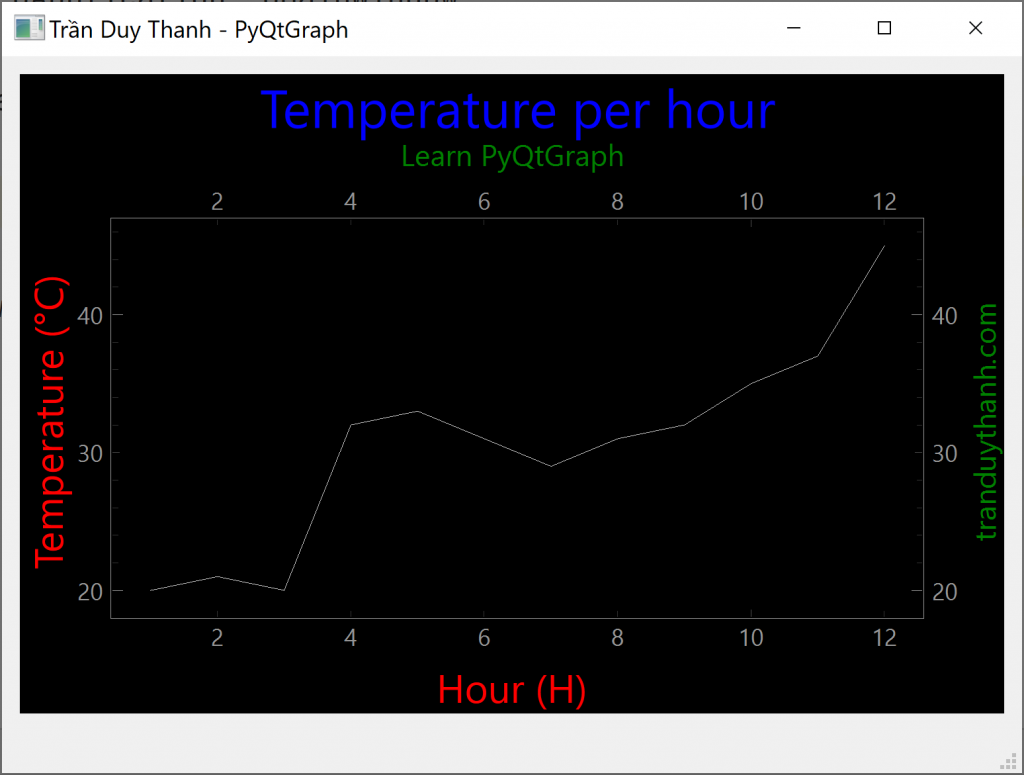
Ở Chart bên trên ta thấy, cả 4 trục đều có tiêu đề.
3. Thiết lập màu nền cho Chart
Bây giờ ta làm quen với phương thức setBackground(). Phương thức đổi thiết lập màu nền có thể nhận các dạng màu sau:
- Dùng Letter code
| Color | Letter Code |
|---|---|
| blue | b |
| green | g |
| red | r |
| cyan | c |
| magenta | m |
| yellow | y |
| black | k |
| white | w |
Ví dụ lệnh dưới đây thiết lập nền trắng cho Chart:
self.graphWidget.setBackground("w")
- Dùng hex color
Danh sách Hex Color bạn có thể lấy nhiều nơi, có thể lấy ở đây:
Ví dụ ta thiết lập màu nền Hex Color #ff0000 màu đỏ:
self.graphWidget.setBackground('#ff0000')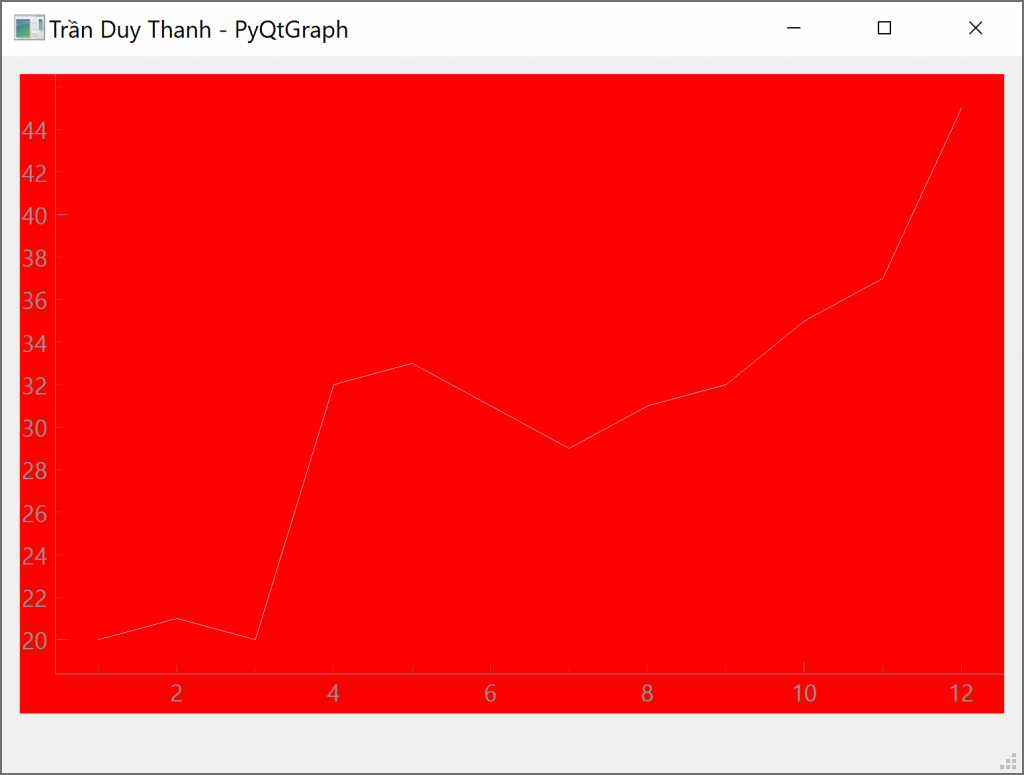
- Sử dụng RGB (Red – Green-Blue) và RGBA (Red – Green – Blue – Alpha Opacity)
Khi dùng RGB thì ta dùng bộ 3:
self.graphWidget.setBackground((100,50,255)) # RGB each 0-255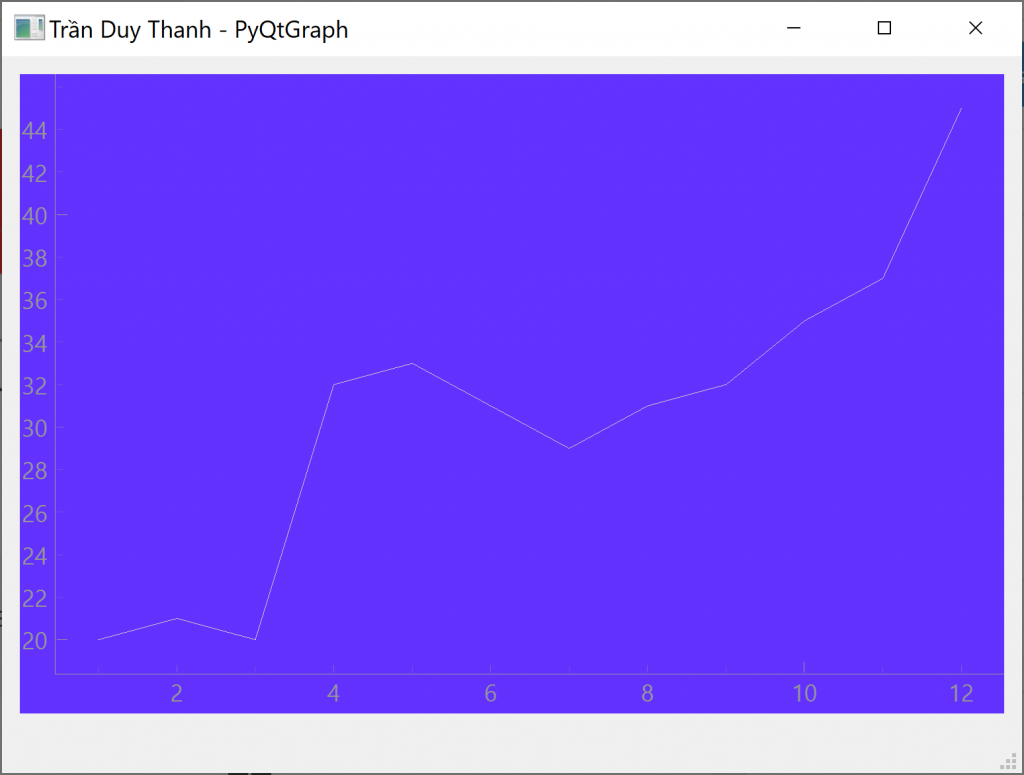
Khi dùng RGBA thì ta dùng bộ 4:
self.graphWidget.setBackground((100,50,255,25)) # RGBA (A = alpha opacity)
- Ngoài ra ta có thể dùng đối tượng QColor để thiết lập màu
self.graphWidget.setBackground(QColor(50, 168, 82,255)) # R, G, B, A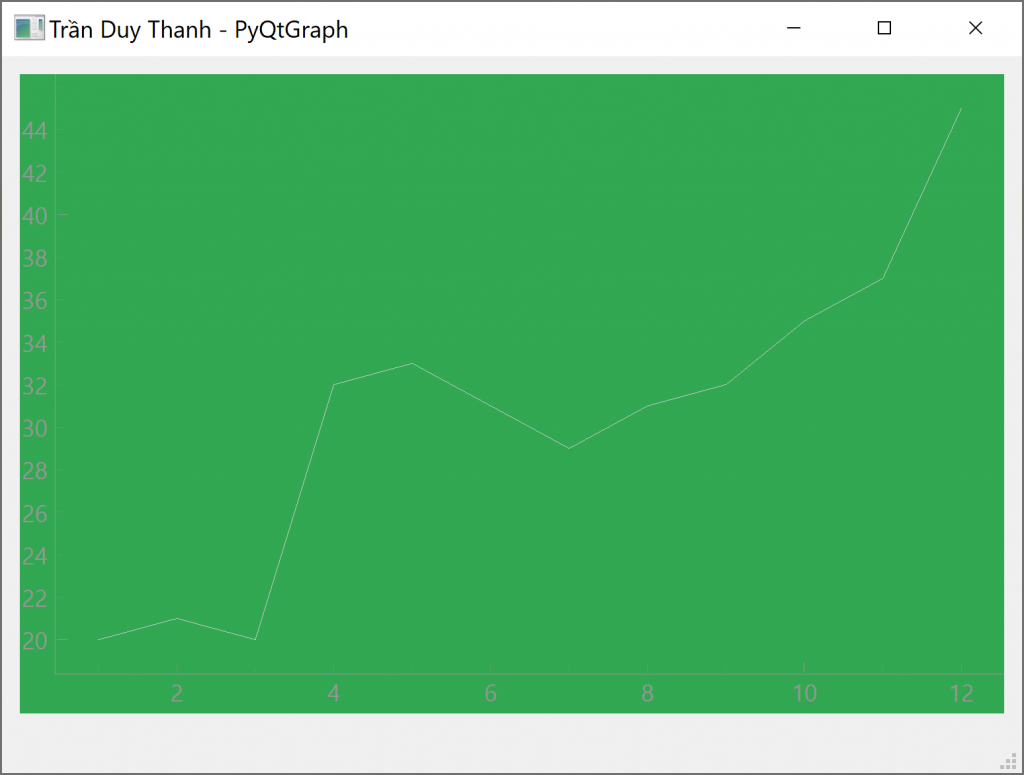
Mã lệnh đầy đủ của MainWindowEx.py để đổi màu nền của Chart qua màu trắng:
#Step 1: import pyqtgraph
import pyqtgraph as pg
from MainWindow import Ui_MainWindow

class MainWindowEx(Ui_MainWindow):
    def __init__(self):
        super().__init__()
    def setupUi(self, MainWindow):
        super().setupUi(MainWindow)
        self.MainWindow=MainWindow
        #Step 2: call pg.PlotWidget()
        self.graphWidget = pg.PlotWidget()
        #self.graphWidget.setTitle("Temperature per hour")
        #self.graphWidget.setTitle("Temperature per hour", color="b", size="30pt")
        #self.graphWidget.setTitle("Temperature per hour", color="b", size="20pt",bold=True,italic=True)
        self.graphWidget.setTitle("<span style=\"color:blue;font-size:20pt\">Temperature per hour</span>")
        styles = {"color": "#f00", "font-size": "20px"}
        self.graphWidget.setLabel("left", "Temperature (°C)", **styles)
        self.graphWidget.setLabel("bottom", "Hour (H)", **styles)
        styles_top_right = {"color": "green", "font-size": "15px"}
        self.graphWidget.setLabel("top", "Learn PyQtGraph",**styles_top_right)
        self.graphWidget.setLabel("right", "tranduythanh.com",**styles_top_right)
        self.graphWidget.setBackground("w")
        #Step 3: Create plot data
        hour = [1, 2, 3, 4, 5, 6, 7, 8, 9, 10,11,12]
        temperature = [20, 21, 20, 32, 33, 31, 29,31, 32, 35,37, 45]
        # Step 4: call plot method
        self.graphWidget.plot(hour, temperature)
        #Step 5: add graphWidget into Layout:
        self.myLayout.addWidget(self.graphWidget)
    def show(self):
        self.MainWindow.show()
Chạy “MyApp.py” ta có kết quả:
4. Thiết lập Background Grid
Để hiển thị lưới cho Chart ta dùng hàm .showGrid()
self.graphWidget.showGrid(x=True, y=True)Ta có thể tùy chỉnh trục nào sẽ xuất hiện lưới, mã lệnh ở trên là hiển thị cả trục tung và trục hoành, dưới đây là mã lệnh đầy đủ của MainWindowEx.py:
#Step 1: import pyqtgraph
import pyqtgraph as pg
from MainWindow import Ui_MainWindow

class MainWindowEx(Ui_MainWindow):
    def __init__(self):
        super().__init__()
    def setupUi(self, MainWindow):
        super().setupUi(MainWindow)
        self.MainWindow=MainWindow
        #Step 2: call pg.PlotWidget()
        self.graphWidget = pg.PlotWidget()
        #self.graphWidget.setTitle("Temperature per hour")
        #self.graphWidget.setTitle("Temperature per hour", color="b", size="30pt")
        #self.graphWidget.setTitle("Temperature per hour", color="b", size="20pt",bold=True,italic=True)
        self.graphWidget.setTitle("<span style=\"color:blue;font-size:20pt\">Temperature per hour</span>")
        styles = {"color": "#f00", "font-size": "20px"}
        self.graphWidget.setLabel("left", "Temperature (°C)", **styles)
        self.graphWidget.setLabel("bottom", "Hour (H)", **styles)
        styles_top_right = {"color": "green", "font-size": "15px"}
        self.graphWidget.setLabel("top", "Learn PyQtGraph",**styles_top_right)
        self.graphWidget.setLabel("right", "tranduythanh.com",**styles_top_right)
        self.graphWidget.setBackground("w")
        self.graphWidget.showGrid(x=True, y=True)
        #Step 3: Create plot data
        hour = [1, 2, 3, 4, 5, 6, 7, 8, 9, 10,11,12]
        temperature = [20, 21, 20, 32, 33, 31, 29,31, 32, 35,37, 45]
        # Step 4: call plot method
        self.graphWidget.plot(hour, temperature)
        #Step 5: add graphWidget into Layout:
        self.myLayout.addWidget(self.graphWidget)
    def show(self):
        self.MainWindow.show()
Chạy “MyApp.py” ta có kết quả:

5. Thiết lập màu, độ rộng và kiểu dáng của đường kẻ
- Bây giờ chúng ta làm quen với đối tượng QPen hiệu chỉnh màu đường kẻ, kiểu đường kẻ, độ dày đường kẻ:
pen = pg.mkPen(color=(255, 0, 0), width=15, style=Qt.PenStyle.DashLine)
self.graphWidget.plot(hour, temperature,pen=pen)
Kiểu của đường kẻ ta dùng như dưới đây:
| Enum Style | Ý nghĩa chức năng |
|---|---|
| Qt.PenStyle.SolidLine | Vẽ đường liên tục |
| Qt.PenStyle.DashLine | Vẽ đường các gạch ngang |
| Qt.PenStyle.DotLine | Vẽ đường các chấm |
| Qt.PenStyle.DashDotLine | Vẽ đường: Gạch ngang – chấm – gạch ngang |
| Qt.PenStyle.DashDotDotLine | Vẽ đường: Gạch ngang – chấm- chấm – gạch ngang |
Coding đầy đủ của MainWindowEx.py:
#Step 1: import pyqtgraph
import pyqtgraph as pg
from PyQt6.QtCore import Qt
from MainWindow import Ui_MainWindow
class MainWindowEx(Ui_MainWindow):
def __init__(self):
super().__init__()
def setupUi(self, MainWindow):
super().setupUi(MainWindow)
self.MainWindow=MainWindow
#Step 2: call pg.PlotWidget()
self.graphWidget = pg.PlotWidget()
#self.graphWidget.setTitle("Temperature per hour")
#self.graphWidget.setTitle("Temperature per hour", color="b", size="30pt")
#self.graphWidget.setTitle("Temperature per hour", color="b", size="20pt",bold=True,italic=True)
self.graphWidget.setTitle("<span style=\"color:blue;font-size:20pt\">Temperature per hour</span>")
styles = {"color": "#f00", "font-size": "20px"}
self.graphWidget.setLabel("left", "Temperature (°C)", **styles)
self.graphWidget.setLabel("bottom", "Hour (H)", **styles)
styles_top_right = {"color": "green", "font-size": "15px"}
self.graphWidget.setLabel("top", "Learn PyQtGraph",**styles_top_right)
self.graphWidget.setLabel("right", "tranduythanh.com",**styles_top_right)
self.graphWidget.setBackground("w")
self.graphWidget.showGrid(x=True, y=True)
#Step 3: Create plot data
hour = [1, 2, 3, 4, 5, 6, 7, 8, 9, 10,11,12]
temperature = [20, 21, 20, 32, 33, 31, 29,31, 32, 35,37, 45]
# Step 4: call plot method
pen = pg.mkPen(color=(255, 0, 0), width=15, style=Qt.PenStyle.DashDotLine)
self.graphWidget.plot(hour, temperature,pen=pen)
#Step 5: add graphWidget into Layout:
self.myLayout.addWidget(self.graphWidget)
def show(self):
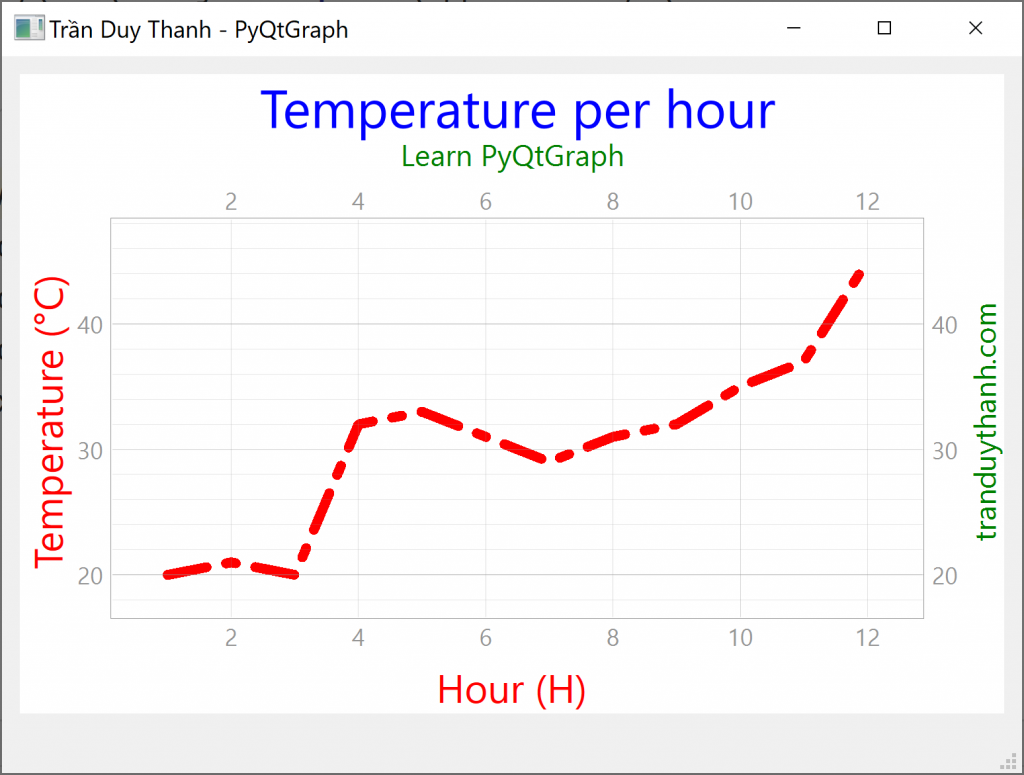
self.MainWindow.show()Chạy MyApp.py ta có kết quả:
6. Thiết lập Line Markers
Để thiết lập Markers cho các Line plot, ta dùng các thuộc tính sau cho hàm plot() của đối tương PlotWidget:
self.graphWidget.plot(hour, temperature, pen=pen, symbol='+', symbolSize=30, symbolBrush=('b'))- symbol: Thiết lập biểu tượng của Marker
| Symbol | Ý nghĩa |
|---|---|
| o | Circular |
| s | Square |
| t | Triangular |
| d | Diamond |
| + | Cross |
- symbolSize: Thiết lập độ lớn của Marker
- symbolBrush: Thiết lập màu của Marker
- symbolPen: Thiết lập màu đường viên của Marker
Dưới đây là coding minh họa phần Marker trong MainWindowEx.py:
#Step 1: import pyqtgraph
import pyqtgraph as pg
from PyQt6.QtCore import Qt

from MainWindow import Ui_MainWindow

class MainWindowEx(Ui_MainWindow):
    def __init__(self):
        super().__init__()
    def setupUi(self, MainWindow):
        super().setupUi(MainWindow)
        self.MainWindow=MainWindow
        #Step 2: call pg.PlotWidget()
        self.graphWidget = pg.PlotWidget()
        #self.graphWidget.setTitle("Temperature per hour")
        #self.graphWidget.setTitle("Temperature per hour", color="b", size="30pt")
        #self.graphWidget.setTitle("Temperature per hour", color="b", size="20pt",bold=True,italic=True)
        self.graphWidget.setTitle("<span style=\"color:blue;font-size:20pt\">Temperature per hour</span>")
        styles = {"color": "#f00", "font-size": "20px"}
        self.graphWidget.setLabel("left", "Temperature (°C)", **styles)
        self.graphWidget.setLabel("bottom", "Hour (H)", **styles)
        styles_top_right = {"color": "green", "font-size": "15px"}
        self.graphWidget.setLabel("top", "Learn PyQtGraph",**styles_top_right)
        self.graphWidget.setLabel("right", "tranduythanh.com",**styles_top_right)
        self.graphWidget.setBackground("w")
        self.graphWidget.showGrid(x=True, y=True)
        #Step 3: Create plot data
        hour = [1, 2, 3, 4, 5, 6, 7, 8, 9, 10,11,12]
        temperature = [20, 21, 20, 32, 33, 31, 29,31, 32, 35,37, 45]
        # Step 4: call plot method
        pen = pg.mkPen(color=(255, 0, 0), width=15, style=Qt.PenStyle.DotLine)
        symbolPen = pg.mkPen(color=(196, 196, 196), width=2)
        self.graphWidget.plot(hour, temperature, pen=pen,
                              symbol='+',
                              symbolSize=15,
                              symbolBrush=('b'),
                              symbolPen=symbolPen)
        #self.graphWidget.plot(hour, temperature,pen=pen)
        #Step 5: add graphWidget into Layout:
        self.myLayout.addWidget(self.graphWidget)
    def show(self):
        self.MainWindow.show()
Chạy MyApp.py ta có kết quả:
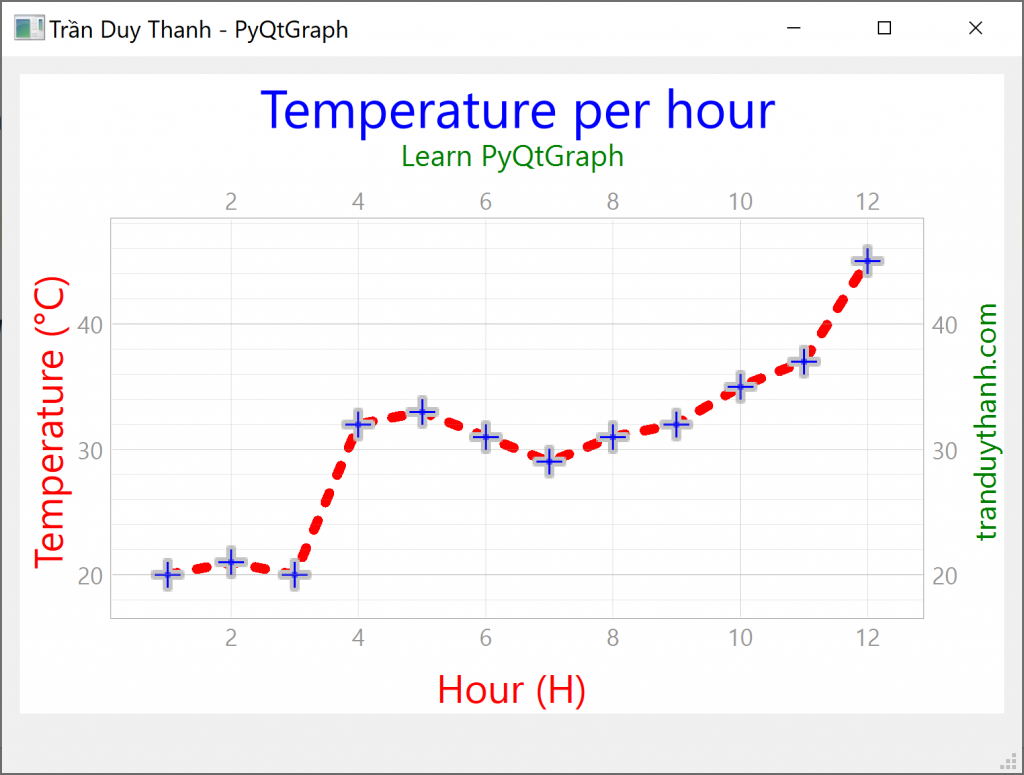
Ta thấy Marker có màu xanh (symbolBrush) và màu viền là xám (symbolPen), biểu tượng + (symbol), kích thước của marker (symbolSize). Ta thử thay thế các symbol khác nhau rồi quan sát so sánh kết quả.
7. Thiết lập Legends
Để thiết lập Legends cho Chart, trước tiên các Line/plot cần được đặt tên khi gọi phương thức plot() của PlotWidget.
Sau đó ta gọi phương thức addLegend() của PlotWidget.
self.graphWidget.addLegend()
self.graphWidget.plot(hour, temperature,name="Sensor X",
                      pen=pen,
                      symbol='+',
                      symbolSize=15,
                      symbolBrush=('b'),
                      symbolPen=symbolPen)
Dưới đây là mã lệnh đầy đủ của MainWindowEx.py để hiển thị Legend:
#Step 1: import pyqtgraph
import pyqtgraph as pg
from PyQt6.QtCore import Qt

from MainWindow import Ui_MainWindow

class MainWindowEx(Ui_MainWindow):
    def __init__(self):
        super().__init__()
    def setupUi(self, MainWindow):
        super().setupUi(MainWindow)
        self.MainWindow=MainWindow
        #Step 2: call pg.PlotWidget()
        self.graphWidget = pg.PlotWidget()
        #self.graphWidget.setTitle("Temperature per hour")
        #self.graphWidget.setTitle("Temperature per hour", color="b", size="30pt")
        #self.graphWidget.setTitle("Temperature per hour", color="b", size="20pt",bold=True,italic=True)
        self.graphWidget.setTitle("<span style=\"color:blue;font-size:20pt\">Temperature per hour</span>")
        styles = {"color": "#f00", "font-size": "20px"}
        self.graphWidget.setLabel("left", "Temperature (°C)", **styles)
        self.graphWidget.setLabel("bottom", "Hour (H)", **styles)
        styles_top_right = {"color": "green", "font-size": "15px"}
        self.graphWidget.setLabel("top", "Learn PyQtGraph",**styles_top_right)
        self.graphWidget.setLabel("right", "tranduythanh.com",**styles_top_right)
        self.graphWidget.setBackground("w")
        self.graphWidget.showGrid(x=True, y=True)
        #Step 3: Create plot data
        hour = [1, 2, 3, 4, 5, 6, 7, 8, 9, 10,11,12]
        temperature = [20, 21, 20, 32, 33, 31, 29,31, 32, 35,37, 45]
        # Step 4: call plot method
        pen = pg.mkPen(color=(255, 0, 0), width=15, style=Qt.PenStyle.DotLine)
        symbolPen = pg.mkPen(color=(196, 196, 196), width=2)
        self.graphWidget.addLegend()
        self.graphWidget.plot(hour, temperature,name="Sensor X",
                              pen=pen,
                              symbol='+',
                              symbolSize=15,
                              symbolBrush=('b'),
                              symbolPen=symbolPen)
        #self.graphWidget.plot(hour, temperature,pen=pen)
        #Step 5: add graphWidget into Layout:
        self.myLayout.addWidget(self.graphWidget)
    def show(self):
        self.MainWindow.show()
Chạy “MyApp.py” ta có kết quả:
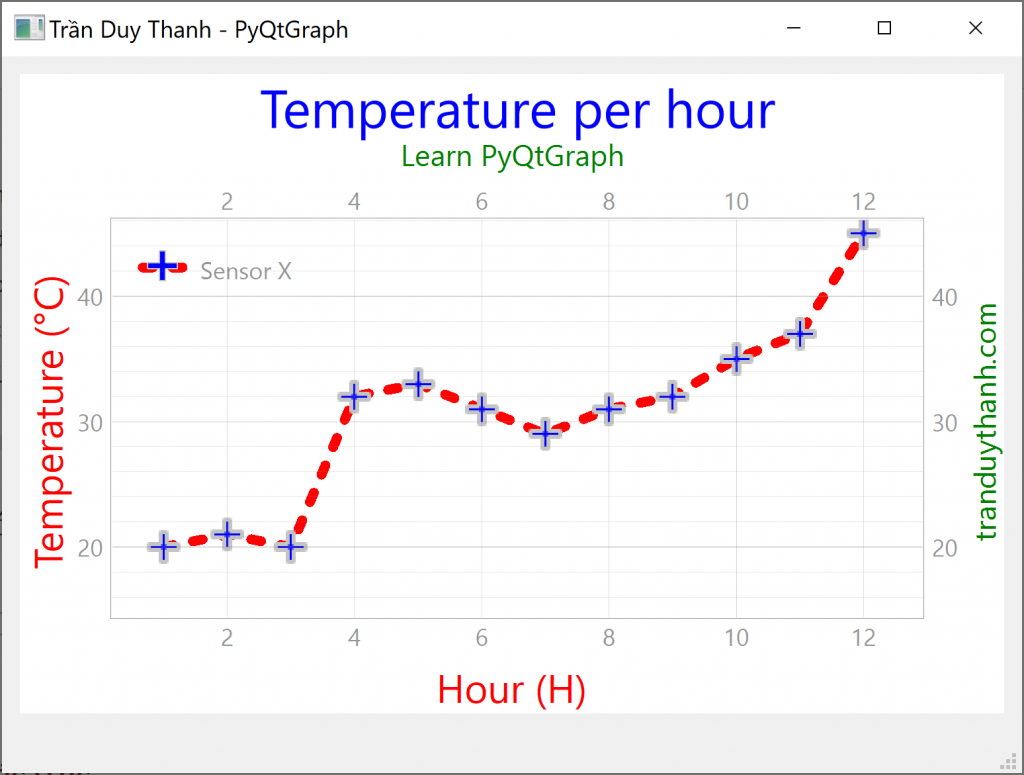
Quan sát Chart ta thấy Legen “Sensor X” được hiển thị mặc định ở góc trái bên trên của Chart, ta có thể dùng chuột để di chuyển.
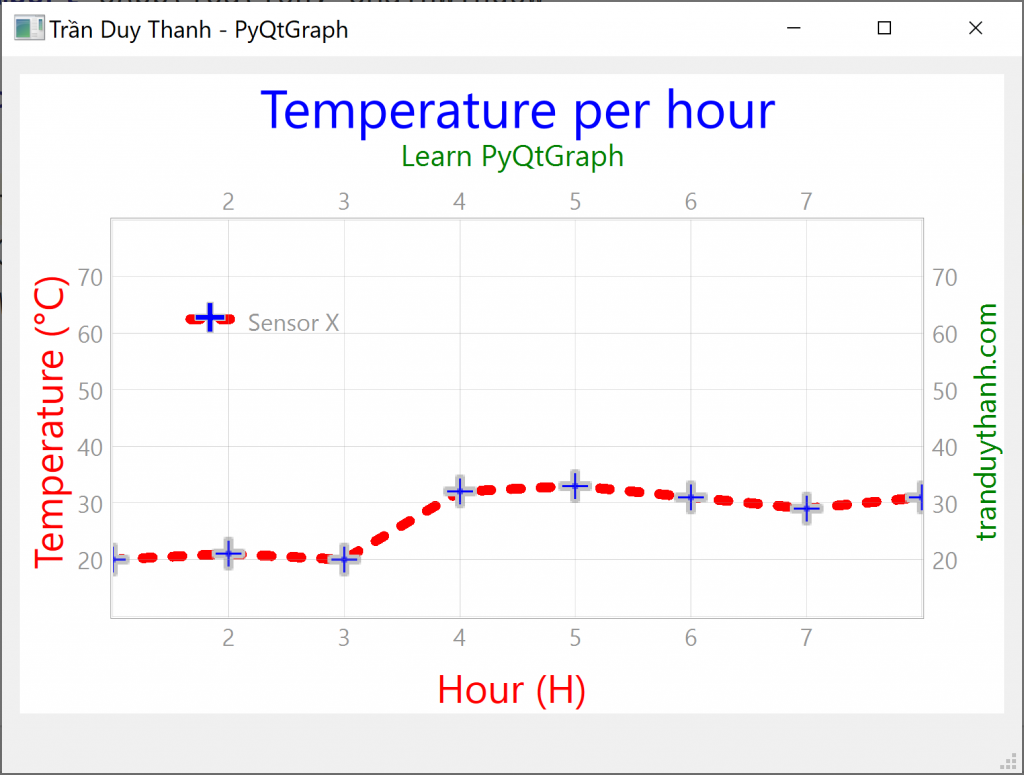
8. Thiết lập giới hạn các trục
Đôi khi trong quá trình trực quan hóa dữ liệu, chúng ta cần thiết phải giới hạn hiển thị dữ liệu ở các trục.
Ta dùng hàm setXRange(min, max,padding) và setYRange(min,max,padding) để giới hạn
Ví dụ:
self.graphWidget.setXRange(1, 8, padding=0)
self.graphWidget.setYRange(10, 80, padding=0)
Dưới đây là mã lệnh đầy đủ của MainWindowEx.py:
#Step 1: import pyqtgraph
import pyqtgraph as pg
from PyQt6.QtCore import Qt

from MainWindow import Ui_MainWindow

class MainWindowEx(Ui_MainWindow):
    def __init__(self):
        super().__init__()
    def setupUi(self, MainWindow):
        super().setupUi(MainWindow)
        self.MainWindow=MainWindow
        #Step 2: call pg.PlotWidget()
        self.graphWidget = pg.PlotWidget()
        #self.graphWidget.setTitle("Temperature per hour")
        #self.graphWidget.setTitle("Temperature per hour", color="b", size="30pt")
        #self.graphWidget.setTitle("Temperature per hour", color="b", size="20pt",bold=True,italic=True)
        self.graphWidget.setTitle("<span style=\"color:blue;font-size:20pt\">Temperature per hour</span>")
        styles = {"color": "#f00", "font-size": "20px"}
        self.graphWidget.setLabel("left", "Temperature (°C)", **styles)
        self.graphWidget.setLabel("bottom", "Hour (H)", **styles)
        styles_top_right = {"color": "green", "font-size": "15px"}
        self.graphWidget.setLabel("top", "Learn PyQtGraph",**styles_top_right)
        self.graphWidget.setLabel("right", "tranduythanh.com",**styles_top_right)
        self.graphWidget.setBackground("w")
        self.graphWidget.showGrid(x=True, y=True)
        #Step 3: Create plot data
        hour = [1, 2, 3, 4, 5, 6, 7, 8, 9, 10,11,12]
        temperature = [20, 21, 20, 32, 33, 31, 29,31, 32, 35,37, 45]
        # Step 4: call plot method
        pen = pg.mkPen(color=(255, 0, 0), width=15, style=Qt.PenStyle.DotLine)
        symbolPen = pg.mkPen(color=(196, 196, 196), width=2)
        self.graphWidget.addLegend()
        self.graphWidget.setXRange(1, 8, padding=0)
        self.graphWidget.setYRange(10, 80, padding=0)
        self.graphWidget.plot(hour, temperature,name="Sensor X",
                              pen=pen,
                              symbol='+',
                              symbolSize=15,
                              symbolBrush=('b'),
                              symbolPen=symbolPen)
        #self.graphWidget.plot(hour, temperature,pen=pen)
        #Step 5: add graphWidget into Layout:
        self.myLayout.addWidget(self.graphWidget)
    def show(self):
        self.MainWindow.show()
Chạy MyApp.py ta có kết quả:
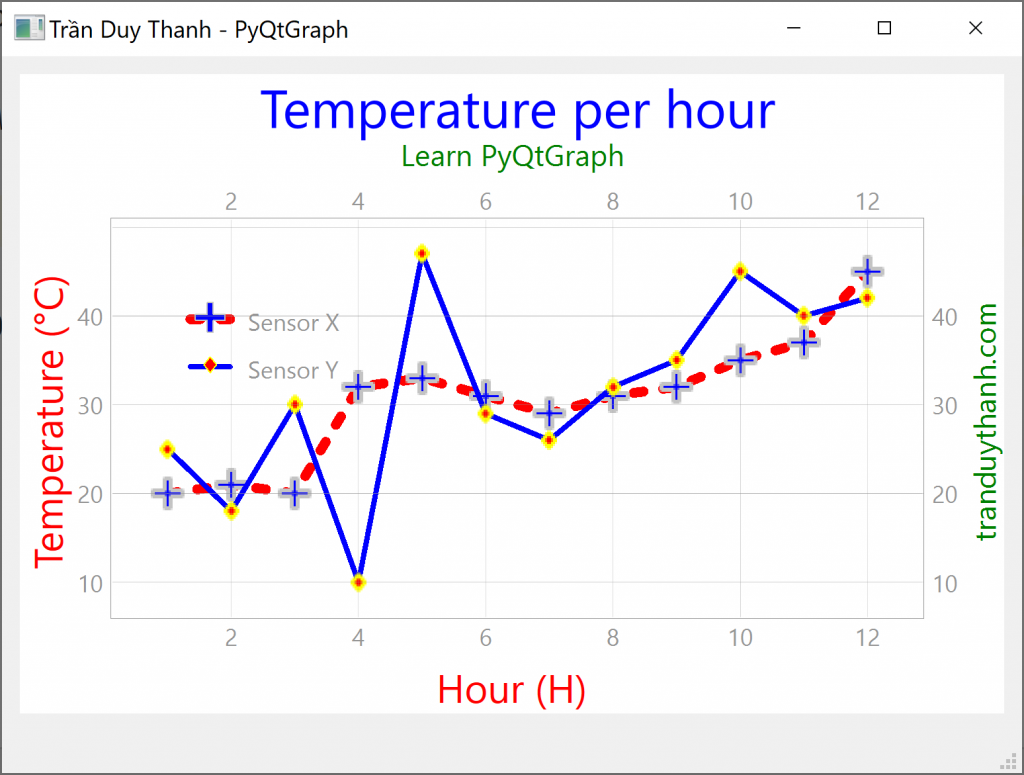
9. Thiết lập multiple plot trong một Chart
Thông thường khi vẽ chart ta hay kết hợp nhiều plot để hiển thị, so sánh…. PyQtGraph cũng hỗ trợ đặc tính này:
hour = [1, 2, 3, 4, 5, 6, 7, 8, 9, 10,11,12]
temperature = [20, 21, 20, 32, 33, 31, 29,31, 32, 35,37, 45]
temperature2 = [25, 18, 30,10, 47, 29, 26, 32, 35, 45, 40, 42]

pen = pg.mkPen(color=(255, 0, 0), width=15, style=Qt.PenStyle.DotLine)
pen2 = pg.mkPen(color=(0, 0, 255), width=8, style=Qt.PenStyle.SolidLine)

symbolPen = pg.mkPen(color=(196, 196, 196), width=2)
symbolPen2 = pg.mkPen(color=(255, 255, 0), width=2)


self.graphWidget.plot(hour, temperature,name="Sensor X",
                      pen=pen,
                      symbol='+',
                      symbolSize=15,
                      symbolBrush=('b'),
                      symbolPen=symbolPen)

self.graphWidget.plot(hour, temperature2, name="Sensor Y",
                      pen=pen2,
                      symbol='d',
                      symbolSize=8,
                      symbolBrush=('r'),
                      symbolPen=symbolPen2)
Mã lệnh ở trên các bạn quan sát Tui bổ sung thêm các biến:
- temperature2: lưu trữ mảng nhiệt độ mới cho Sensor Y
- pen2: thiết lập đường kẻ thứ 2
- symbolPen2: thiết lập biểu tượng cho đường kẻ thứ 2
Và Ta gọi 2 lần hàm plot() của đối tượng PlotWidget (biến graphWidget)
Dưới đây là mã lệnh đẩy đủ của MainWindowEx.py:
#Step 1: import pyqtgraph
import pyqtgraph as pg
from PyQt6.QtCore import Qt
from MainWindow import Ui_MainWindow
class MainWindowEx(Ui_MainWindow):
def __init__(self):
super().__init__()
def setupUi(self, MainWindow):
super().setupUi(MainWindow)
self.MainWindow=MainWindow
#Step 2: call pg.PlotWidget()
self.graphWidget = pg.PlotWidget()
#self.graphWidget.setTitle("Temperature per hour")
#self.graphWidget.setTitle("Temperature per hour", color="b", size="30pt")
#self.graphWidget.setTitle("Temperature per hour", color="b", size="20pt",bold=True,italic=True)
self.graphWidget.setTitle("<span style=\"color:blue;font-size:20pt\">Temperature per hour</span>")
styles = {"color": "#f00", "font-size": "20px"}
self.graphWidget.setLabel("left", "Temperature (°C)", **styles)
self.graphWidget.setLabel("bottom", "Hour (H)", **styles)
styles_top_right = {"color": "green", "font-size": "15px"}
self.graphWidget.setLabel("top", "Learn PyQtGraph",**styles_top_right)
self.graphWidget.setLabel("right", "tranduythanh.com",**styles_top_right)
self.graphWidget.setBackground("w")
self.graphWidget.showGrid(x=True, y=True)
#Step 3: Create plot data
hour = [1, 2, 3, 4, 5, 6, 7, 8, 9, 10,11,12]
temperature = [20, 21, 20, 32, 33, 31, 29,31, 32, 35,37, 45]
temperature2 = [25, 18, 30,10, 47, 29, 26, 32, 35, 45, 40, 42]
# Step 4: call plot method
pen = pg.mkPen(color=(255, 0, 0), width=15, style=Qt.PenStyle.DotLine)
pen2 = pg.mkPen(color=(0, 0, 255), width=8, style=Qt.PenStyle.SolidLine)
symbolPen = pg.mkPen(color=(196, 196, 196), width=2)
symbolPen2 = pg.mkPen(color=(255, 255, 0), width=2)
self.graphWidget.addLegend()
#self.graphWidget.setXRange(1, 8, padding=0)
#self.graphWidget.setYRange(10, 80, padding=0)
self.graphWidget.plot(hour, temperature,name="Sensor X",
pen=pen,
symbol='+',
symbolSize=15,
symbolBrush=('b'),
symbolPen=symbolPen)
self.graphWidget.plot(hour, temperature2, name="Sensor Y",
pen=pen2,
symbol='d',
symbolSize=8,
symbolBrush=('r'),
symbolPen=symbolPen2)
#self.graphWidget.plot(hour, temperature,pen=pen)
#Step 5: add graphWidget into Layout:
self.myLayout.addWidget(self.graphWidget)
def show(self):
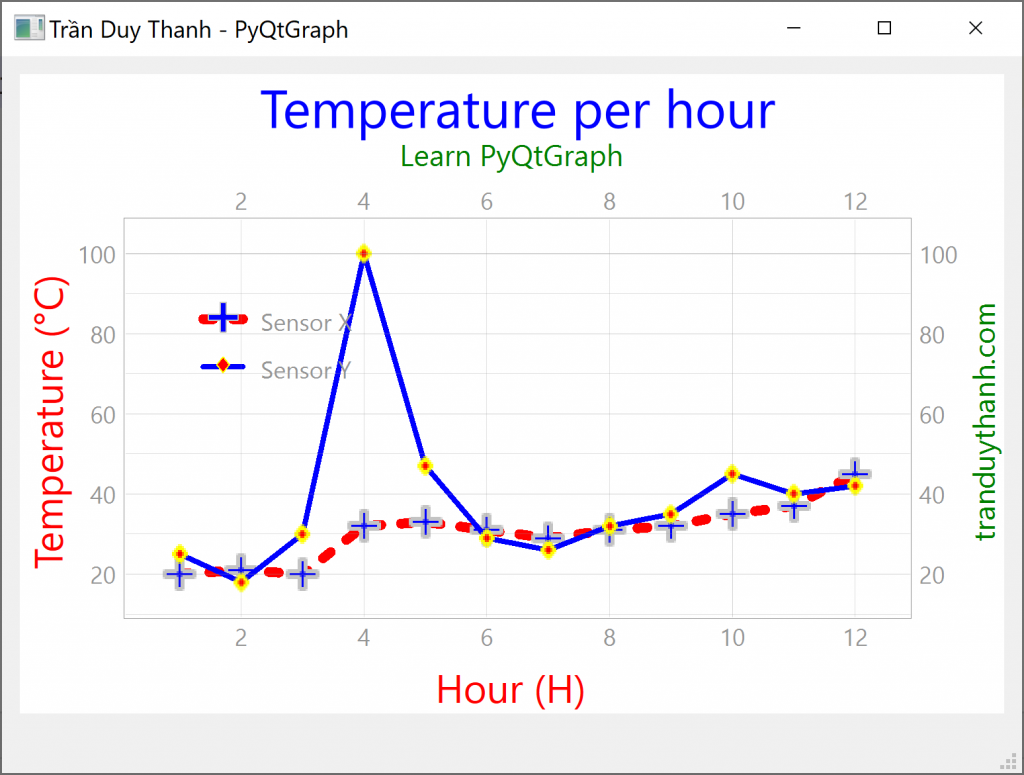
self.MainWindow.show()Chạy “MyApp.py” ta có kết quả:
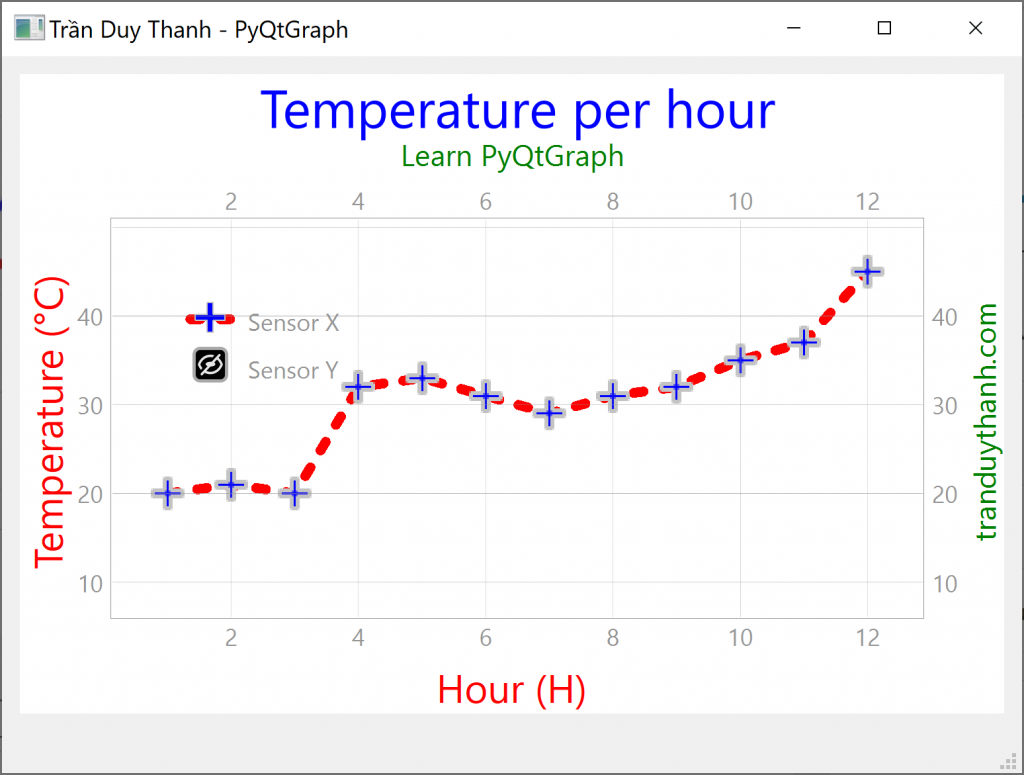
Ta có thể ẩn/hiển thị các Plot bằng cách nhấn vào Legend, ví dụ như muốn ẩn Sensor Y:
Ta có thể áp dụng kỹ thuật của Multiple Line để tự động nạp nhiều Plot cho 1 Chart. Ví dụ như hãy vẽ biểu đồ doanh thu từng tháng của 10 chi nhánh trong năm 2023.
10. Xóa và cập nhật Plot
Để xóa Plot trên Chart ta gọi lệnh:
self.graphWidget.clear()Trong quá trình hiển thị Chart, đặc biệt là liên quan tới Realtime data thì rõ ràng ta muốn Chart được cập nhật tự động.
Bước 1: Khai báo đối tượng lưu trữ lại Plot, ví dụ ta khai báo plot 2 cho Sensor Y
plot2=self.graphWidget.plot(hour, temperature2, name="Sensor Y",
                              pen=pen2,
                              symbol='d',
                              symbolSize=8,
                              symbolBrush=('r'),
                              symbolPen=symbolPen2)
Bước 2: Thay đổi giá trị trong mảng temperature2, ví dụ:
temperature2[3]=100Ở bước 2 này tức là nếu trong quá trình vận hành trực quan hóa, mà bất cứ khi nào đó mảng dữ liệu bị thay đổi. Ở đây là Tui minh họa 1 trường hợp phần tử thứ 3 bị đổi dữ liệu
Bước 3: Gọi hàm setData() của plot2 để cập nhật Plot
plot2.setData(hour, temperature2)Code đầy đủ của MainWindowEx.py cho phần cập nhật Plot:
#Step 1: import pyqtgraph
import pyqtgraph as pg
from PyQt6.QtCore import Qt

from MainWindow import Ui_MainWindow

class MainWindowEx(Ui_MainWindow):
    def __init__(self):
        super().__init__()
    def setupUi(self, MainWindow):
        super().setupUi(MainWindow)
        self.MainWindow=MainWindow
        #Step 2: call pg.PlotWidget()
        self.graphWidget = pg.PlotWidget()
        #self.graphWidget.setTitle("Temperature per hour")
        #self.graphWidget.setTitle("Temperature per hour", color="b", size="30pt")
        #self.graphWidget.setTitle("Temperature per hour", color="b", size="20pt",bold=True,italic=True)
        self.graphWidget.setTitle("<span style=\"color:blue;font-size:20pt\">Temperature per hour</span>")
        styles = {"color": "#f00", "font-size": "20px"}
        self.graphWidget.setLabel("left", "Temperature (°C)", **styles)
        self.graphWidget.setLabel("bottom", "Hour (H)", **styles)
        styles_top_right = {"color": "green", "font-size": "15px"}
        self.graphWidget.setLabel("top", "Learn PyQtGraph",**styles_top_right)
        self.graphWidget.setLabel("right", "tranduythanh.com",**styles_top_right)
        self.graphWidget.setBackground("w")
        self.graphWidget.showGrid(x=True, y=True)
        #Step 3: Create plot data
        hour = [1, 2, 3, 4, 5, 6, 7, 8, 9, 10,11,12]
        temperature = [20, 21, 20, 32, 33, 31, 29,31, 32, 35,37, 45]
        temperature2 = [25, 18, 30,10, 47, 29, 26, 32, 35, 45, 40, 42]
        # Step 4: call plot method
        pen = pg.mkPen(color=(255, 0, 0), width=15, style=Qt.PenStyle.DotLine)
        pen2 = pg.mkPen(color=(0, 0, 255), width=8, style=Qt.PenStyle.SolidLine)
        symbolPen = pg.mkPen(color=(196, 196, 196), width=2)
        symbolPen2 = pg.mkPen(color=(255, 255, 0), width=2)
        self.graphWidget.addLegend()
        #self.graphWidget.setXRange(1, 8, padding=0)
        #self.graphWidget.setYRange(10, 80, padding=0)
        self.graphWidget.plot(hour, temperature,name="Sensor X",
                              pen=pen,
                              symbol='+',
                              symbolSize=15,
                              symbolBrush=('b'),
                              symbolPen=symbolPen)
        plot2=self.graphWidget.plot(hour, temperature2, name="Sensor Y",
                              pen=pen2,
                              symbol='d',
                              symbolSize=8,
                              symbolBrush=('r'),
                              symbolPen=symbolPen2)
        temperature2[3]=100
        plot2.setData(hour, temperature2)
        #self.graphWidget.plot(hour, temperature,pen=pen)
        #Step 5: add graphWidget into Layout:
        self.myLayout.addWidget(self.graphWidget)
    def show(self):
        self.MainWindow.show()
Chạy MyApp.py ta thấy temperature2[3]=100 được update.

Dựa vào tính năng nay ta có thể viết code tự động update dữ liệu theo thời gian.
Như vậy tới Tui đã hướng dẫn đầy đủ và chi tiết các chức năng quan trọng và thường dùng của PlotWidget trong trực quan hóa dữ liệu. Các bạn chú ý làm lại nhiều lần và hiểu thật rõ, áp dụng thật tốt từng kỹ thuật để giúp cho trực quan hóa được tốt nhất.
Các bạn tải mã lệnh đầy đủ của dự án ở đây:
https://www.mediafire.com/file/7s7lkzsmsoyufy0/LearnPyQtGraphPart2.rar/file
Bài học sau Tui sẽ minh họa cách sử dụng PyQtGraph và OpenGL để hiển thị 3D Graph, các bạn chú ý theo dõi
Chúc các bạn thành công
2 thoughts on “Bài 32: Trực quan hóa dữ liệu – PyQtGraph-PlotWidget-PyQt6 – Part 2”