Chúng ta đã biết cách sử dụng BarGraph để trực quan hóa dữ liệu ở các bài học trước, Lập trình xử lý sự kiện được trên BarGraph như ẩn hiện Background Grid, ẩn hiện Legend, thay đổi màu nền của Chart, thay đổi màu nền của Bar bằng QColorDialog. Với các bài minh họa trước thì các bạn đã có thể ứng dụng vào việc trực quan hóa dữ liệu dạng Bar ở một số trường hợp trong thực tế.
Trong bài học này Tui bổ sung thêm 2 kỹ thuật: Viết mã lệnh để tự động gán label cho các Bar Item, và viết mã lệnh để tự động tạo các Tick cho trục X của Chart nhằm làm rõ nghĩa cho các cột này thay vì chỉ các con số.
Đặc biệt Tui sẽ lập trình để 2 chức năng này có thể tự động hiểu được các Bar Chart theo dữ liệu khác nhau, có thể hiển thị chính xác theo Bar Item đơn hay nhóm các Bar Item, và các label có khả năng khớp màu với màu của mỗi Bar Item tương ứng.
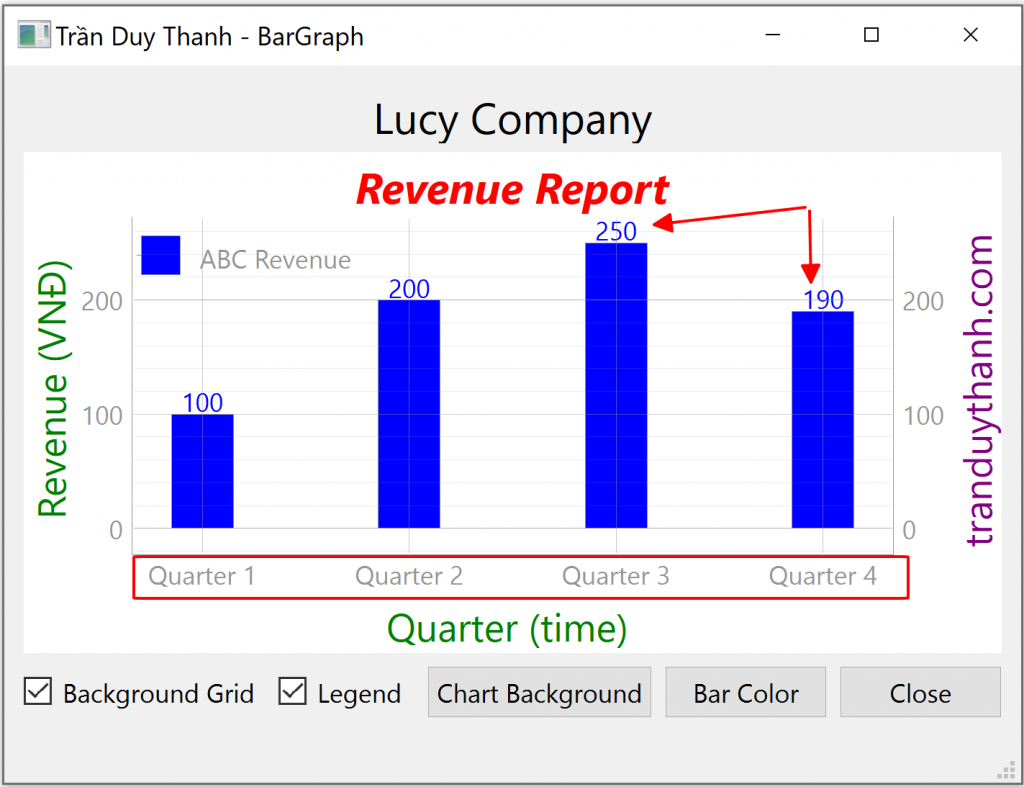
- Ở trên ta thấy Trục X thay vì chỉ hiển thị các con số 1, 2, 3, 4 mà nó được hiển thị bằng chuỗi “Quarter 1”, “Quarter 2”, “Quarter 3”, và “Quarter 4”
- Đồng thời trên mỗi Bar item ta có các giá trị được hiển thị, ta gọi nó là label hoặc notation. Ví dụ ta thấy cột đầu tiên có giá trị 100, cột thứ 2 có giá trị 200, vân vân.
Rõ ràng việc hiển thị các Tick và Label sẽ giúp Chart được rõ nghĩa và dễ quan sát hơn.
Như vậy bài này sẽ có giao diện giống như bài trước, và các mã lệnh của một số chức năng cũng y chang nên Tui sẽ không giải thích lại các hàm này. Mà Tui chỉ nói tới 2 giải thuật về tự động tick và tự động label thôi.
Dưới đây là chi tiết từng bước thực hiện dự án:
Bước 1: Tạo dự án “LearnPyQtBarGraphPart5” trong Pycharm có cấu trúc như dưới đây:
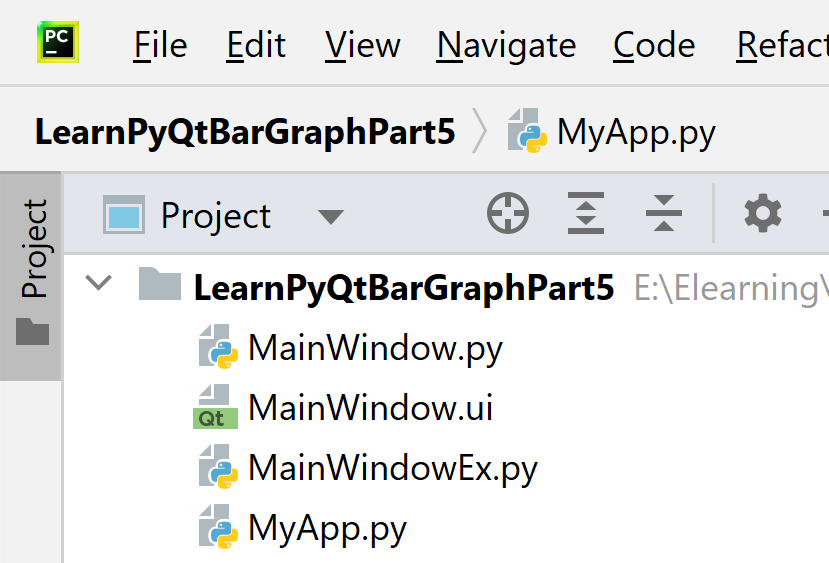
- “MainWindow.ui” là giao diện thiết kế tương tác người dùng bằng Qt Designer
- “MainWindow.py” là Generate Python code cho giao diện “MainWindow.ui”
- “MainWindowEx.py” là file mã lệnh kế thừa từ Generate Python Code để xử lý: Nạp giao diện, hiển thị chart, gán sự kiện và không bị lệ thuộc vào giao diện bị thay đổi sau này khi Generate lại code
- “MyApp.py” là file mã lệnh thực thi chương trình.
Bước 2: Thiết kế giao diện “MainWindow.ui” và đặt tên cho Widget/layout như hình dưới đây:
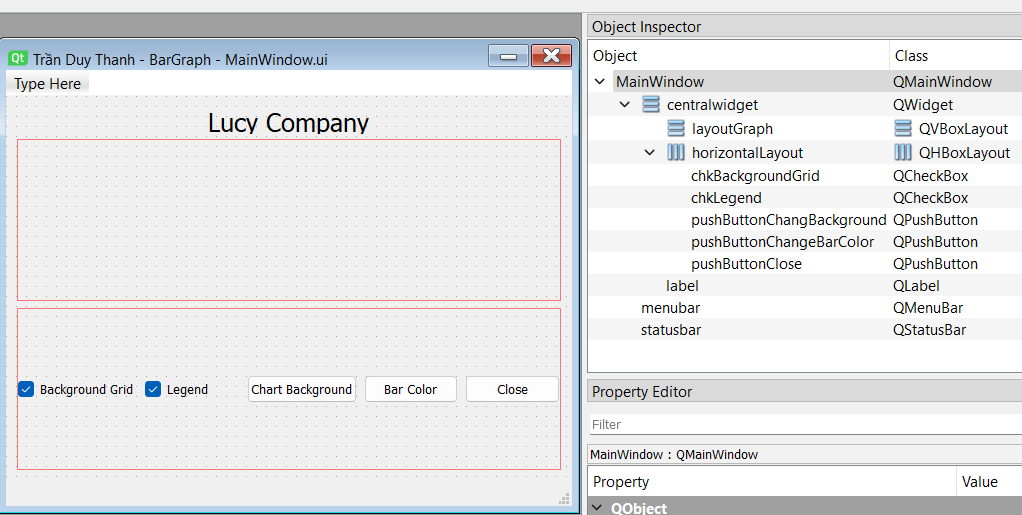
Bạn lần lượt kéo thả các Widget vào giao diện như trên, lưu ý việc lựa chọn các Layout cho phù hợp.
Bước 3: Generate Python Code cho “MainWindow.ui”, lúc này mã lệnh “MainWindow.py” tự động được tạo ra:
# Form implementation generated from reading ui file 'MainWindow.ui'
#
# Created by: PyQt6 UI code generator 6.5.2
#
# WARNING: Any manual changes made to this file will be lost when pyuic6 is
# run again.  Do not edit this file unless you know what you are doing.


from PyQt6 import QtCore, QtGui, QtWidgets


class Ui_MainWindow(object):
    def setupUi(self, MainWindow):
        MainWindow.setObjectName("MainWindow")
        MainWindow.resize(566, 436)
        self.centralwidget = QtWidgets.QWidget(parent=MainWindow)
        self.centralwidget.setObjectName("centralwidget")
        self.verticalLayout_2 = QtWidgets.QVBoxLayout(self.centralwidget)
        self.verticalLayout_2.setObjectName("verticalLayout_2")
        self.label = QtWidgets.QLabel(parent=self.centralwidget)
        sizePolicy = QtWidgets.QSizePolicy(QtWidgets.QSizePolicy.Policy.Preferred, QtWidgets.QSizePolicy.Policy.Fixed)
        sizePolicy.setHorizontalStretch(0)
        sizePolicy.setVerticalStretch(0)
        sizePolicy.setHeightForWidth(self.label.sizePolicy().hasHeightForWidth())
        self.label.setSizePolicy(sizePolicy)
        self.label.setMinimumSize(QtCore.QSize(0, 25))
        self.label.setMaximumSize(QtCore.QSize(16777215, 20))
        font = QtGui.QFont()
        font.setPointSize(15)
        self.label.setFont(font)
        self.label.setAlignment(QtCore.Qt.AlignmentFlag.AlignCenter)
        self.label.setObjectName("label")
        self.verticalLayout_2.addWidget(self.label)
        self.layoutGraph = QtWidgets.QVBoxLayout()
        self.layoutGraph.setSizeConstraint(QtWidgets.QLayout.SizeConstraint.SetDefaultConstraint)
        self.layoutGraph.setObjectName("layoutGraph")
        self.verticalLayout_2.addLayout(self.layoutGraph)
        self.horizontalLayout = QtWidgets.QHBoxLayout()
        self.horizontalLayout.setObjectName("horizontalLayout")
        self.chkBackgroundGrid = QtWidgets.QCheckBox(parent=self.centralwidget)
        self.chkBackgroundGrid.setChecked(True)
        self.chkBackgroundGrid.setObjectName("chkBackgroundGrid")
        self.horizontalLayout.addWidget(self.chkBackgroundGrid)
        self.chkLegend = QtWidgets.QCheckBox(parent=self.centralwidget)
        self.chkLegend.setChecked(True)
        self.chkLegend.setObjectName("chkLegend")
        self.horizontalLayout.addWidget(self.chkLegend)
        self.pushButtonChangBackground = QtWidgets.QPushButton(parent=self.centralwidget)
        self.pushButtonChangBackground.setObjectName("pushButtonChangBackground")
        self.horizontalLayout.addWidget(self.pushButtonChangBackground)
        self.pushButtonChangeBarColor = QtWidgets.QPushButton(parent=self.centralwidget)
        self.pushButtonChangeBarColor.setObjectName("pushButtonChangeBarColor")
        self.horizontalLayout.addWidget(self.pushButtonChangeBarColor)
        self.pushButtonClose = QtWidgets.QPushButton(parent=self.centralwidget)
        self.pushButtonClose.setObjectName("pushButtonClose")
        self.horizontalLayout.addWidget(self.pushButtonClose)
        self.verticalLayout_2.addLayout(self.horizontalLayout)
        MainWindow.setCentralWidget(self.centralwidget)
        self.menubar = QtWidgets.QMenuBar(parent=MainWindow)
        self.menubar.setGeometry(QtCore.QRect(0, 0, 566, 22))
        self.menubar.setObjectName("menubar")
        MainWindow.setMenuBar(self.menubar)
        self.statusbar = QtWidgets.QStatusBar(parent=MainWindow)
        self.statusbar.setObjectName("statusbar")
        MainWindow.setStatusBar(self.statusbar)

        self.retranslateUi(MainWindow)
        self.pushButtonClose.clicked.connect(MainWindow.close) # type: ignore
        QtCore.QMetaObject.connectSlotsByName(MainWindow)

    def retranslateUi(self, MainWindow):
        _translate = QtCore.QCoreApplication.translate
        MainWindow.setWindowTitle(_translate("MainWindow", "Trần Duy Thanh - BarGraph"))
        self.label.setText(_translate("MainWindow", "Lucy Company"))
        self.chkBackgroundGrid.setText(_translate("MainWindow", "Background Grid"))
        self.chkLegend.setText(_translate("MainWindow", "Legend"))
        self.pushButtonChangBackground.setText(_translate("MainWindow", "Chart Background"))
        self.pushButtonChangeBarColor.setText(_translate("MainWindow", "Bar Color"))
        self.pushButtonClose.setText(_translate("MainWindow", "Close"))
Bước 4: Viết mã lệnh cho “MainWindowEx.py”
Chú ý rằng các mã lệnh nó y chang như bài 34, còn bài này Ta chỉ bổ sung thêm 2 giải thuật cho Auto Tick và Auto Label. Do đó Tui sẽ gửi code đầy đủ ở đây, và ở bên dưới Tui sẽ giải thích 2 giải thuật này:
from PyQt6.QtCore import Qt, QPointF
from PyQt6.QtWidgets import QColorDialog

from MainWindow import Ui_MainWindow
import numpy as np
import pyqtgraph as pg

class MainWindowEx(Ui_MainWindow):
    def __init__(self):
        super().__init__()
    def setupUi(self, MainWindow):
        super().setupUi(MainWindow)
        self.MainWindow=MainWindow
        self.setupBarGraph()

        self.xlab = ["Quarter 1", "Quarter 2", "Quarter 3", "Quarter 4"]

        self.autoTick(self.graphWidget,self.xlab)

        self.autolabel([self.bargraphItem])
Trong hàm setupUi() ta khai báo và gọi 3 lệnh:
self.xlab = ["Quarter 1", "Quarter 2", "Quarter 3", "Quarter 4"]Lệnh trên khai báo mảng chuỗi để hiển thị Tick ở bottom của Chart, nó sẽ thay thế cho các giá trị số, việc hiển thị chuỗi như này sẽ giúp cho Chart được rõ nghĩa hơn.
Lệnh:
self.autoTick(self.graphWidget,self.xlab)
Để gán các Tick
def autoTick(self,graphWidget, xlab):
    ticks = []
    for i, item in enumerate(xlab):
        ticks.append((i + 1, item))
    ticks = [ticks]
    ax = graphWidget.getAxis('bottom')
    ax.setTicks(ticks)
Hàm autoTick nhận vào 2 đối số:
-Đối số 1 là graphWidget (đối tượng PlotWidget)
– Đối số 2 là xlab là mảng chuỗi để hiển thị Tick
Vòng lặp mã lệnh bên trong autoTick ta sẽ đưa các chuỗi tick vào mảng ticks.
Lệnh graphWidget.getAxis(‘bottom’) để truy suất trục bottom,
Sau đó ta gọi lệnh setTicks(ticks) lúc này chương trình sẽ gán các Tick lên giao diện
Lệnh self.autolabel([self.bargraphItem]) để gán label cho mỗi Bar Item:
def autolabel(self,barItems):
    # attach some text labels
    for barItem in barItems:
        xs, heights = barItem.getData()
        for i in range(len(heights)):
            height = heights[i]
            x = xs[i]
            clr = barItem.opts["brush"]
            text = pg.TextItem(str(height), color=clr)
            text.setParentItem(barItem)
            text.setX(x)
            text.setY(height)
            text.setAnchor((QPointF(0.5, 0.75)))
Hàm autolabel sẽ nhận vào 1 mảng BarGraphItem, Tui thiết kế đối số là mảng để chương trình có thể tự động hiểu được tùy ý số nhóm và số bar item trong mỗi nhóm.
Hàm barItem.getData() sẽ trả về 2 dữ liệu: xs mảng trục bottom, heights mảng độ cao của Bar Item (mảng giá trị mà ta trực quan hóa). Dựa vào 2 dữ liệu này ta dễ dàng phân bổ các vị trí label phù hợp
Ta dùng lệnh: pg.TextItem() để tạo các TextItem tương ứng với từng nhóm Bar Item, và nó được vẽ chính xác vị trí thông qua hàm setX(), setY().
Lệnh setAnchor() giúp neo label theo tọa độ cho từng Bar Item.
Dưới đây là mã lệnh đầy đủ của “MainWindowEx.py“:
from PyQt6.QtCore import Qt, QPointF
from PyQt6.QtWidgets import QColorDialog

from MainWindow import Ui_MainWindow
import numpy as np
import pyqtgraph as pg

class MainWindowEx(Ui_MainWindow):
    def __init__(self):
        super().__init__()
    def setupUi(self, MainWindow):
        super().setupUi(MainWindow)
        self.MainWindow=MainWindow
        self.setupBarGraph()

        self.xlab = ["Quarter 1", "Quarter 2", "Quarter 3", "Quarter 4"]

        self.autoTick(self.graphWidget,self.xlab)

        self.autolabel([self.bargraphItem])

    def setupBarGraph(self):
        self.graphWidget = pg.PlotWidget()
        self.graphWidget.setTitle("Revenue Report", color="r", size="15pt", bold=True, italic=True)
        self.graphWidget.setBackground('w')

        labelStyle = {"color": "green", "font-size": "18px"}
        labelBrandStyle = {"color": "purple", "font-size": "18px"}
        self.graphWidget.setLabel("left","Revenue (VNĐ)",**labelStyle)
        self.graphWidget.setLabel("bottom","Quarter (time)",**labelStyle)
        self.graphWidget.setLabel("right", "tranduythanh.com", **labelBrandStyle)
        self.graphWidget.showGrid(x=True, y=True)

        width = 0.3

        quarter = np.array([1, 2, 3, 4])
        revenue = [100, 200, 250, 190]

        self.bargraphItem = pg.BarGraphItem(x=quarter, height=revenue, width=width, brush='b', name="ABC Revenue")

        self.legend=self.graphWidget.addLegend()

        self.graphWidget.addItem(self.bargraphItem)
        self.layoutGraph.addWidget( self.graphWidget)

        self.chkBackgroundGrid.stateChanged.connect(self.processChangeGrid)
        self.chkLegend.stateChanged.connect(self.processChangeLegend)
        self.pushButtonChangBackground.clicked.connect(self.processChangeChartBackground)
        self.pushButtonChangeBarColor.clicked.connect(self.processChangeBarColor)
    def processChangeGrid(self,value):
        state=Qt.CheckState(value)
        if state==Qt.CheckState.Checked:
            self.graphWidget.showGrid(x=True, y=True)
        else:
            self.graphWidget.showGrid(x=False, y=False)
    def processChangeLegend(self,value):
        state=Qt.CheckState(value)
        if state==Qt.CheckState.Checked:
            self.legend.show()
        else:
            self.legend.hide()
    def processChangeChartBackground(self):
        dialog = QColorDialog()
        if dialog.exec():
            color = dialog.currentColor()
            self.graphWidget.setBackground(color.name())
            del dialog
    def processChangeBarColor(self):
        dialog = QColorDialog()
        if dialog.exec():
            color = dialog.currentColor()
            self.bargraphItem.opts["brush"]=color.name()
            self.bargraphItem._updateColors(self.bargraphItem.opts)
            del dialog
    def autoTick(self,graphWidget, xlab):
        ticks = []
        for i, item in enumerate(xlab):
            ticks.append((i + 1, item))
        ticks = [ticks]
        ax = graphWidget.getAxis('bottom')
        ax.setTicks(ticks)

    def autolabel(self,barItems):
        # attach some text labels
        for barItem in barItems:
            xs, heights = barItem.getData()
            for i in range(len(heights)):
                height = heights[i]
                x = xs[i]
                clr = barItem.opts["brush"]
                text = pg.TextItem(str(height), color=clr)
                text.setParentItem(barItem)
                text.setX(x)
                text.setY(height)
                text.setAnchor((QPointF(0.5, 0.75)))

    def show(self):
        self.MainWindow.show()
Bước 5: Viết mã lệnh “MyApp.py” để thực thi chương trình:
from PyQt6.QtWidgets import QApplication, QMainWindow

from MainWindowEx import MainWindowEx

app=QApplication([])
myWindow=MainWindowEx()
myWindow.setupUi(QMainWindow())
myWindow.show()
app.exec()
Chạy “MyApp.py” ta có kết quả như mong muốn:

Như vậy tới đây Tui đã trình bày xong cách lập trình xử lý trực quan hóa dữ liệu với BarGraph. Ôn tập lại cách khai báo các mảng dữ liệu tương ứng với các trục, Ôn tập cách gọi các hàm liên quan tới BarGraphItem để hiển thị Chart. Cũng như ôn tập lại được toàn bộ kiến thức liên quan tới PlotWidget. Đặc biệt các bạn biết cách tương tác Chart thông qua các QCheckBox và QPushButton để tương tác lưới của chart, tương tác legend, đổi màu chart và màu bar.
Đồng thời bài này Tui hướng dẫn các bạn cách lập trình để Auto Tick, và Auto Label cho Bar. Nó có ý nghĩa quan trọng để giúp Chart được rõ nghĩa, đọc dễ hiểu hơn.
Soure code của bài này các bạn tải ở đây:
https://www.mediafire.com/file/gypdzk2ajb61fni/LearnPyQtBarGraphPart5.rar/file
Bài học sau Tui sẽ hướng cách vẽ Multiple Bar Item trên cùng một Chart. Đây là tính năng rất quan trọng và phổ biến để trực quan hóa dữ liệu trong việc so sánh kết quả.
Các bạn chú ý theo dõi
Chúc các bạn thành công
One thought on “Bài 35: Trực quan hóa dữ liệu – PyQtGraph-BarGraph-PyQt6 – Part 5”