Bài này chúng ta sẽ trực quan hóa dạng Multiple Bar Graph và nó được mở rộng từ bài trước.
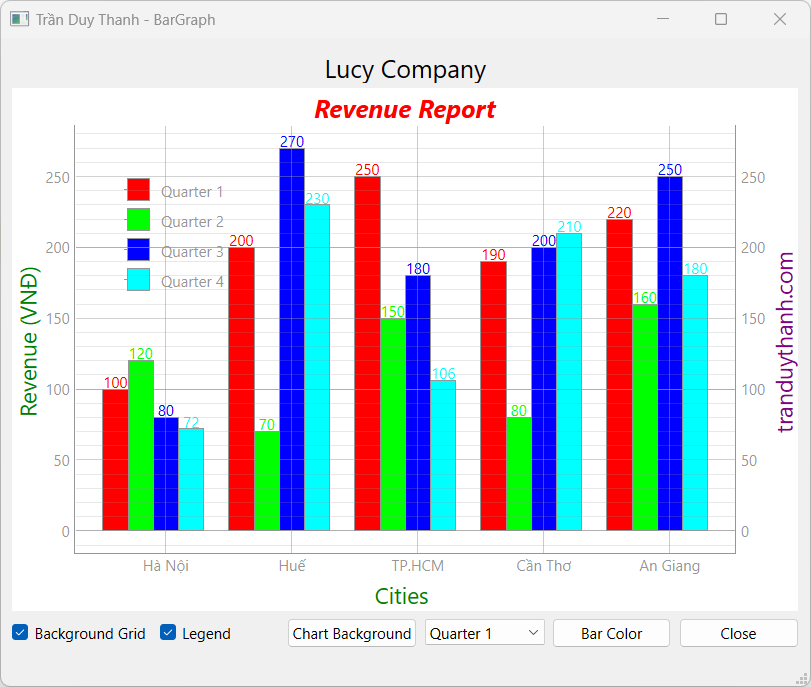
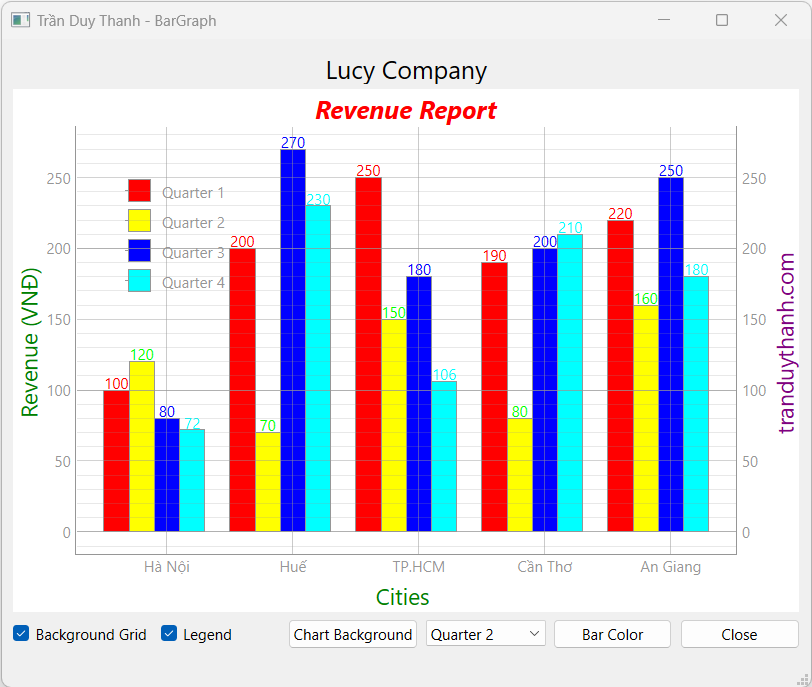
Giả sử chúng ta có doanh số trung bình của công ty Lucy ở các chi nhánh Hà Nội, Huế, TP.HCM, Cần Thơ và An Giang theo 4 quý như sau:
| Hà Nội | Huế | TP.HCM | Cần Thơ | An Giang | |
| Quarter 1 | 100 | 200 | 250 | 190 | 220 |
| Quarter 2 | 120 | 70 | 150 | 80 | 160 |
| Quarter 3 | 80 | 270 | 180 | 200 | 250 |
| Quarter 4 | 72 | 230 | 106 | 210 | 180 |
Sau khi viết các mã lệnh trực quan hóa thì ta có giao diện như dưới đây:
Sự khác biệt lớn của bài này là ở 2 chỗ:
- Có nhiều Bar Item ở mỗi nhóm trực quan
- Khi đổi Bar Color thì người dùng có thể lực chọn từng Bar Item để đổi màu, các Bar Item này được hiển thị trong QComboBox.
Chúng ta thực hiện các bước như sau:
Bước 1: Tạo dự án tên “LearnPyQtBarGraphPart6” có cấu trúc như dưới đây:
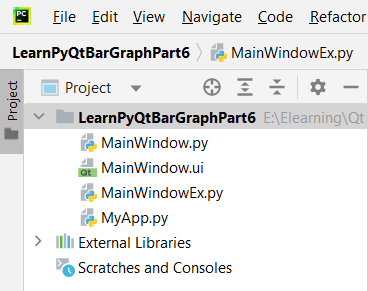
- “MainWindow.ui” là giao diện thiết kế tương tác người dùng bằng Qt Designer
- “MainWindow.py” là Generate Python code cho giao diện “MainWindow.ui”
- “MainWindowEx.py” là file mã lệnh kế thừa từ Generate Python Code để xử lý: Nạp giao diện, hiển thị chart, gán sự kiện và không bị lệ thuộc vào giao diện bị thay đổi sau này khi Generate lại code
- “MyApp.py” là file mã lệnh thực thi chương trình.
Bước 2: Thiết kế giao diện “MainWindow.ui” và đặt tên cho Widget/layout như hình dưới đây:
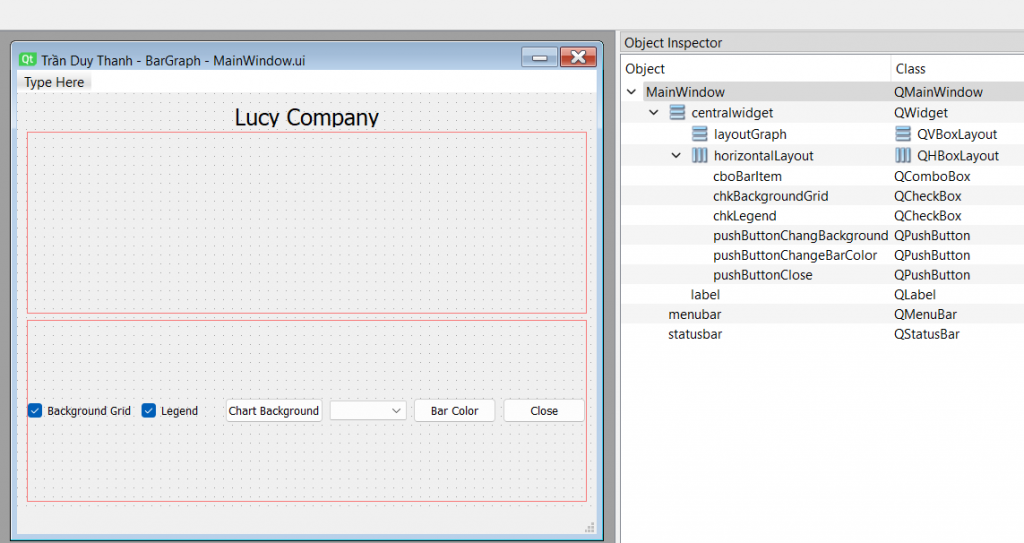
Bạn lần lượt kéo thả các Widget vào giao diện như trên, lưu ý việc lựa chọn các Layout cho phù hợp.
Bước 3: Generate Python Code cho “MainWindow.ui”, lúc này mã lệnh “MainWindow.py” tự động được tạo ra:
# Form implementation generated from reading ui file 'MainWindow.ui'
#
# Created by: PyQt6 UI code generator 6.4.2
#
# WARNING: Any manual changes made to this file will be lost when pyuic6 is
# run again.  Do not edit this file unless you know what you are doing.


from PyQt6 import QtCore, QtGui, QtWidgets


class Ui_MainWindow(object):
    def setupUi(self, MainWindow):
        MainWindow.setObjectName("MainWindow")
        MainWindow.resize(647, 518)
        self.centralwidget = QtWidgets.QWidget(parent=MainWindow)
        self.centralwidget.setObjectName("centralwidget")
        self.verticalLayout_2 = QtWidgets.QVBoxLayout(self.centralwidget)
        self.verticalLayout_2.setObjectName("verticalLayout_2")
        self.label = QtWidgets.QLabel(parent=self.centralwidget)
        sizePolicy = QtWidgets.QSizePolicy(QtWidgets.QSizePolicy.Policy.Preferred, QtWidgets.QSizePolicy.Policy.Fixed)
        sizePolicy.setHorizontalStretch(0)
        sizePolicy.setVerticalStretch(0)
        sizePolicy.setHeightForWidth(self.label.sizePolicy().hasHeightForWidth())
        self.label.setSizePolicy(sizePolicy)
        self.label.setMinimumSize(QtCore.QSize(0, 25))
        self.label.setMaximumSize(QtCore.QSize(16777215, 20))
        font = QtGui.QFont()
        font.setPointSize(15)
        self.label.setFont(font)
        self.label.setAlignment(QtCore.Qt.AlignmentFlag.AlignCenter)
        self.label.setObjectName("label")
        self.verticalLayout_2.addWidget(self.label)
        self.layoutGraph = QtWidgets.QVBoxLayout()
        self.layoutGraph.setSizeConstraint(QtWidgets.QLayout.SizeConstraint.SetDefaultConstraint)
        self.layoutGraph.setObjectName("layoutGraph")
        self.verticalLayout_2.addLayout(self.layoutGraph)
        self.horizontalLayout = QtWidgets.QHBoxLayout()
        self.horizontalLayout.setObjectName("horizontalLayout")
        self.chkBackgroundGrid = QtWidgets.QCheckBox(parent=self.centralwidget)
        self.chkBackgroundGrid.setChecked(True)
        self.chkBackgroundGrid.setObjectName("chkBackgroundGrid")
        self.horizontalLayout.addWidget(self.chkBackgroundGrid)
        self.chkLegend = QtWidgets.QCheckBox(parent=self.centralwidget)
        self.chkLegend.setChecked(True)
        self.chkLegend.setObjectName("chkLegend")
        self.horizontalLayout.addWidget(self.chkLegend)
        self.pushButtonChangBackground = QtWidgets.QPushButton(parent=self.centralwidget)
        self.pushButtonChangBackground.setObjectName("pushButtonChangBackground")
        self.horizontalLayout.addWidget(self.pushButtonChangBackground)
        self.cboBarItem = QtWidgets.QComboBox(parent=self.centralwidget)
        self.cboBarItem.setObjectName("cboBarItem")
        self.horizontalLayout.addWidget(self.cboBarItem)
        self.pushButtonChangeBarColor = QtWidgets.QPushButton(parent=self.centralwidget)
        self.pushButtonChangeBarColor.setObjectName("pushButtonChangeBarColor")
        self.horizontalLayout.addWidget(self.pushButtonChangeBarColor)
        self.pushButtonClose = QtWidgets.QPushButton(parent=self.centralwidget)
        self.pushButtonClose.setObjectName("pushButtonClose")
        self.horizontalLayout.addWidget(self.pushButtonClose)
        self.verticalLayout_2.addLayout(self.horizontalLayout)
        MainWindow.setCentralWidget(self.centralwidget)
        self.menubar = QtWidgets.QMenuBar(parent=MainWindow)
        self.menubar.setGeometry(QtCore.QRect(0, 0, 647, 26))
        self.menubar.setObjectName("menubar")
        MainWindow.setMenuBar(self.menubar)
        self.statusbar = QtWidgets.QStatusBar(parent=MainWindow)
        self.statusbar.setObjectName("statusbar")
        MainWindow.setStatusBar(self.statusbar)

        self.retranslateUi(MainWindow)
        self.pushButtonClose.clicked.connect(MainWindow.close) # type: ignore
        QtCore.QMetaObject.connectSlotsByName(MainWindow)

    def retranslateUi(self, MainWindow):
        _translate = QtCore.QCoreApplication.translate
        MainWindow.setWindowTitle(_translate("MainWindow", "Trần Duy Thanh - BarGraph"))
        self.label.setText(_translate("MainWindow", "Lucy Company"))
        self.chkBackgroundGrid.setText(_translate("MainWindow", "Background Grid"))
        self.chkLegend.setText(_translate("MainWindow", "Legend"))
        self.pushButtonChangBackground.setText(_translate("MainWindow", "Chart Background"))
        self.pushButtonChangeBarColor.setText(_translate("MainWindow", "Bar Color"))
        self.pushButtonClose.setText(_translate("MainWindow", "Close"))
Bước 4: Viết mã lệnh cho “MainWindowEx.py”
Khai báo lớp MainWindowEx kết thừa từ Generate Python code ở bước 3, dưới đây là hàm override setupUi để định nghĩa các thành phần cho Bar Chart:
from PyQt6.QtCore import Qt, QPointF
from PyQt6.QtWidgets import QColorDialog

from MainWindow import Ui_MainWindow
import numpy as np
import pyqtgraph as pg

class MainWindowEx(Ui_MainWindow):
    def __init__(self):
        super().__init__()
    def setupUi(self, MainWindow):
        super().setupUi(MainWindow)
        self.MainWindow=MainWindow

        self.width = 0.2
        self.xlab = ["Hà Nội", "Huế", "TP.HCM", "Cần Thơ", "An Giang"]
        self.titleLegends=["Quarter 1","Quarter 2","Quarter 3","Quarter 4"]
        self.positions = np.array([1, 2, 3, 4, 5])
        self.revenues = [[100, 200, 250, 190, 220],
                         [120, 70, 150, 80, 160],
                         [80, 270, 180, 200, 250],
                         [72, 230, 106, 210, 180]
                         ]
        self.brushes=["r","g","b","c"]
        self.bargraphItems=[]

        self.setupBarGraph()

        self.autoTick(self.graphWidget,self.xlab)

        self.autolabel(self.bargraphItems)
Mã lệnh ở trên Tui định nghĩa các tiêu đề cho 5 thành phố (Hà Nội, Huế, TP.HCM, Cần Thơ, An Giang) và các doanh thu tương ứng theo các quý.
Đồng thời khai báo mảng các màu brushes (r, g, b, c) cho các Bar Item.
Trong setupUi() có gọi các hàm setupBarGraph(), autoTick(), và autoLabel()
Dưới đây là hàm setupBarGraph để vẽ Multiple Bar Graph:
def setupBarGraph(self):
    self.graphWidget = pg.PlotWidget()
    self.graphWidget.setTitle("Revenue Report", color="r", size="15pt", bold=True, italic=True)
    self.graphWidget.setBackground('w')

    labelStyle = {"color": "green", "font-size": "18px"}
    labelBrandStyle = {"color": "purple", "font-size": "18px"}
    self.graphWidget.setLabel("left","Revenue (VNĐ)",**labelStyle)
    self.graphWidget.setLabel("bottom","Cities",**labelStyle)
    self.graphWidget.setLabel("right", "tranduythanh.com", **labelBrandStyle)
    self.graphWidget.showGrid(x=True, y=True)

    self.legend = self.graphWidget.addLegend()
    self.bargraphItems.clear()
    self.cboBarItem.clear()
    for i in range(len(self.revenues)):
        bargraphItem = pg.BarGraphItem(
            x=self.positions+i*self.width,
            height=self.revenues[i],
            width=self.width,
            brush=self.brushes[i],
            name=self.titleLegends[i])
        self.bargraphItems.append(bargraphItem)
        self.graphWidget.addItem(bargraphItem)
        self.cboBarItem.addItem(bargraphItem.name(),bargraphItem)

    self.layoutGraph.addWidget( self.graphWidget)

    self.chkBackgroundGrid.stateChanged.connect(self.processChangeGrid)
    self.chkLegend.stateChanged.connect(self.processChangeLegend)
    self.pushButtonChangBackground.clicked.connect(self.processChangeChartBackground)
    self.pushButtonChangeBarColor.clicked.connect(self.processChangeBarColor)
Các mã lệnh ở trên đã được giải thích chi tiết ở những bài học trước do đó các bạn cần xem lại. Chỉ có chỗ vòng lặp là Tui dùng để duyệt qua từng phần tử trong ma trận revenues, mỗi lần duyệt sẽ tạo ra một BarGraphItem và tiến hành định dạng cho nó.
Trong vòng lặp ngoài việc vẽ các Bar Item thì nó cũng đưa tên và bar item object vào bên trong QCombox để cho người sử dụng có thể lựa chọn từng Bar item trên giao diện để đổi màu theo mong muốn của họ.
Ở cuối hàm setupUi() cũng gọi các signal như hiển thị/ẩn lưới của chart, ẩn hiện Legend, đổi màu nền chart, đổi bar item color.
Hàm ẩn hiển thị lưới processChangeGrid():
def processChangeGrid(self,value):
    state=Qt.CheckState(value)
    if state==Qt.CheckState.Checked:
        self.graphWidget.showGrid(x=True, y=True)
    else:
        self.graphWidget.showGrid(x=False, y=False)
Hàm ẩn hiển thị legend processChangeLegend():
def processChangeLegend(self,value):
    state=Qt.CheckState(value)
    if state==Qt.CheckState.Checked:
        self.legend.show()
    else:
        self.legend.hide()
Hàm thay đổi màu nền của Chart processChangeChartBackground():
def processChangeChartBackground(self):
    dialog = QColorDialog()
    if dialog.exec():
        color = dialog.currentColor()
        self.graphWidget.setBackground(color.name())
        del dialog
Hàm thay đổi màu của từng Baritem, lưu ý là người sử dụng sẽ chọn Bar item trong QComboBox trước, sau đó nhấn vào button “bar color” để đổi màu:
def processChangeBarColor(self):
    dialog = QColorDialog()
    if dialog.exec():
        color = dialog.currentColor()
        bargraphItem=self.bargraphItems[self.cboBarItem.currentIndex()]
        bargraphItem.opts["brush"]=color.name()
        bargraphItem._updateColors(bargraphItem.opts)
        del dialog
Ví dụ chọn Quarter 2 trên giao diện:
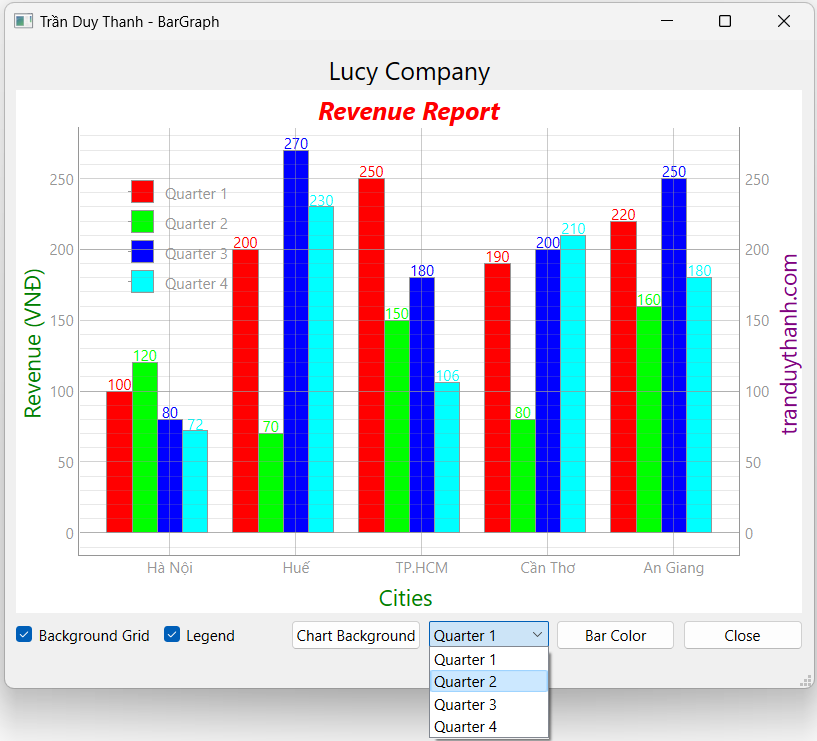
Sau đó chọn Bar Color button:
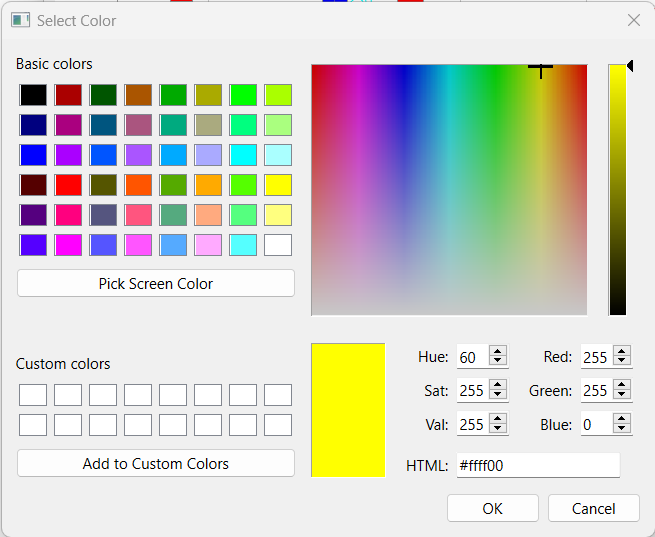
Sau khi nhấn OK ta có màu vàng được thiết lập cho Bar Item Quarter 2:
Hàm autoTick() sẽ thiết lập label cho các thành phố ở bottom Cities:
def autoTick(self,graphWidget, xlab):
    ticks = []
    for i, item in enumerate(xlab):
        ticks.append((i +1+ 2*self.width, item))
    ticks = [ticks]
    ax = graphWidget.getAxis('bottom')
    ax.setTicks(ticks)
Hàm autolabel() sẽ thiết lập label cho các Bar Item:
def autolabel(self,barItems):
    # attach some text labels
    for barItem in barItems:
        xs, heights = barItem.getData()
        for i in range(len(heights)):
            height = heights[i]
            x = xs[i]
            clr = barItem.opts["brush"]
            text = pg.TextItem(str(height), color=clr)
            text.setParentItem(barItem)
            text.setX(x)
            text.setY(height)
            text.setAnchor((QPointF(0.5, 0.75)))
Label cho từng Bar item giúp người sử dụng dễ dàng quan sát và so sánh cũng như đánh giá dữ liệu.
Dưới đây là coding đầy đủ của MainWindowEx.py:
from PyQt6.QtCore import Qt, QPointF
from PyQt6.QtWidgets import QColorDialog

from MainWindow import Ui_MainWindow
import numpy as np
import pyqtgraph as pg

class MainWindowEx(Ui_MainWindow):
    def __init__(self):
        super().__init__()
    def setupUi(self, MainWindow):
        super().setupUi(MainWindow)
        self.MainWindow=MainWindow

        self.width = 0.2
        self.xlab = ["Hà Nội", "Huế", "TP.HCM", "Cần Thơ", "An Giang"]
        self.titleLegends=["Quarter 1","Quarter 2","Quarter 3","Quarter 4"]
        self.positions = np.array([1, 2, 3, 4, 5])
        self.revenues = [[100, 200, 250, 190, 220],
                         [120, 70, 150, 80, 160],
                         [80, 270, 180, 200, 250],
                         [72, 230, 106, 210, 180]
                         ]
        self.brushes=["r","g","b","c"]
        self.bargraphItems=[]

        self.setupBarGraph()

        self.autoTick(self.graphWidget,self.xlab)

        self.autolabel(self.bargraphItems)
    def setupBarGraph(self):
        self.graphWidget = pg.PlotWidget()
        self.graphWidget.setTitle("Revenue Report", color="r", size="15pt", bold=True, italic=True)
        self.graphWidget.setBackground('w')

        labelStyle = {"color": "green", "font-size": "18px"}
        labelBrandStyle = {"color": "purple", "font-size": "18px"}
        self.graphWidget.setLabel("left","Revenue (VNĐ)",**labelStyle)
        self.graphWidget.setLabel("bottom","Cities",**labelStyle)
        self.graphWidget.setLabel("right", "tranduythanh.com", **labelBrandStyle)
        self.graphWidget.showGrid(x=True, y=True)

        self.legend = self.graphWidget.addLegend()
        self.bargraphItems.clear()
        self.cboBarItem.clear()
        for i in range(len(self.revenues)):
            bargraphItem = pg.BarGraphItem(
                x=self.positions+i*self.width,
                height=self.revenues[i],
                width=self.width,
                brush=self.brushes[i],
                name=self.titleLegends[i])
            self.bargraphItems.append(bargraphItem)
            self.graphWidget.addItem(bargraphItem)
            self.cboBarItem.addItem(bargraphItem.name(),bargraphItem)

        self.layoutGraph.addWidget( self.graphWidget)

        self.chkBackgroundGrid.stateChanged.connect(self.processChangeGrid)
        self.chkLegend.stateChanged.connect(self.processChangeLegend)
        self.pushButtonChangBackground.clicked.connect(self.processChangeChartBackground)
        self.pushButtonChangeBarColor.clicked.connect(self.processChangeBarColor)
    def processChangeGrid(self,value):
        state=Qt.CheckState(value)
        if state==Qt.CheckState.Checked:
            self.graphWidget.showGrid(x=True, y=True)
        else:
            self.graphWidget.showGrid(x=False, y=False)
    def processChangeLegend(self,value):
        state=Qt.CheckState(value)
        if state==Qt.CheckState.Checked:
            self.legend.show()
        else:
            self.legend.hide()
    def processChangeChartBackground(self):
        dialog = QColorDialog()
        if dialog.exec():
            color = dialog.currentColor()
            self.graphWidget.setBackground(color.name())
            del dialog
    def processChangeBarColor(self):
        dialog = QColorDialog()
        if dialog.exec():
            color = dialog.currentColor()
            bargraphItem=self.bargraphItems[self.cboBarItem.currentIndex()]
            bargraphItem.opts["brush"]=color.name()
            bargraphItem._updateColors(bargraphItem.opts)
            del dialog
    def autoTick(self,graphWidget, xlab):
        ticks = []
        for i, item in enumerate(xlab):
            ticks.append((i +1+ 2*self.width, item))
        ticks = [ticks]
        ax = graphWidget.getAxis('bottom')
        ax.setTicks(ticks)

    def autolabel(self,barItems):
        # attach some text labels
        for barItem in barItems:
            xs, heights = barItem.getData()
            for i in range(len(heights)):
                height = heights[i]
                x = xs[i]
                clr = barItem.opts["brush"]
                text = pg.TextItem(str(height), color=clr)
                text.setParentItem(barItem)
                text.setX(x)
                text.setY(height)
                text.setAnchor((QPointF(0.5, 0.75)))

    def show(self):
        self.MainWindow.show()
Bước 5: Viết mã lệnh “MyApp.py” để thực thi chương trình:
from PyQt6.QtWidgets import QApplication, QMainWindow

from MainWindowEx import MainWindowEx

app=QApplication([])
myWindow=MainWindowEx()
myWindow.setupUi(QMainWindow())
myWindow.show()
app.exec()
Thực thi MyApp.py ta có kết quả:

Như vậy tới đây Tui đã trình bày xong cách lập trình xử lý trực quan hóa dữ liệu với Multiple BarGraph. Ôn tập lại cách khai báo các mảng dữ liệu tương ứng với các trục, Ôn tập cách gọi các hàm liên quan tới BarGraphItem để hiển thị Chart. Cũng như ôn tập lại được toàn bộ kiến thức liên quan tới PlotWidget.
Ôn tập cách tương tác Chart thông qua các QCheckBox và QPushButton để tương tác lưới của chart, tương tác legend, đổi màu chart và màu bar.
Ôn tập cách lập trình để Auto Tick, và Auto Label cho Bar. Nó có ý nghĩa quan trọng để giúp Chart được rõ nghĩa, đọc dễ hiểu hơn.
Đặc biệt trong bài này chúng ta biết cách vẽ Multiple Bar Item lên 1 Chart, nạp được bar item vào QComboBox để người dùng có thể tùy ý chọn màu cho từng Bar item. Đây là bài học ứng dụng thực tế rất cao. Các bạn chú ý làm lại nhiều lần để thuần thục về kỹ thuật, cũng như biết cách áp dụng vào các bài multiple chart tương tự
Soure code của bài này các bạn tải ở đây:
https://www.mediafire.com/file/gyv9hgo9ezgro0e/LearnPyQtBarGraphPart6.rar/file
Bài học sau Tui sẽ hướng dẫn các bạn cách nạp dữ liệu từ Excel vào phần mềm Python và vẽ lên Bar chart. Nó cũng là một bài áp dụng trong thức tế, Các bạn chú ý theo dõi
Chúc các bạn thành công
One thought on “Bài 36: Trực quan hóa dữ liệu – PyQtGraph-Multiple BarGraph-PyQt6 – Part 6”