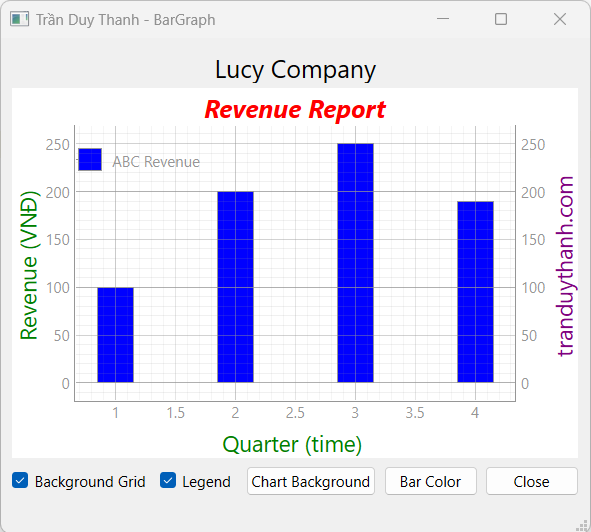
Trong bài học 39 Tui đã minh họa cách xử lý đa tiến trình để vẽ giao diện và tương tác thời gian thực mà chương trình không bị treo. Trong bài học này Tui tiếp tục minh họa phần cập nhật giao diện QTableWidget thời gian thực bằng kỹ thuật xử lý đa tiến trình có giao diện tương tự như dưới đây:
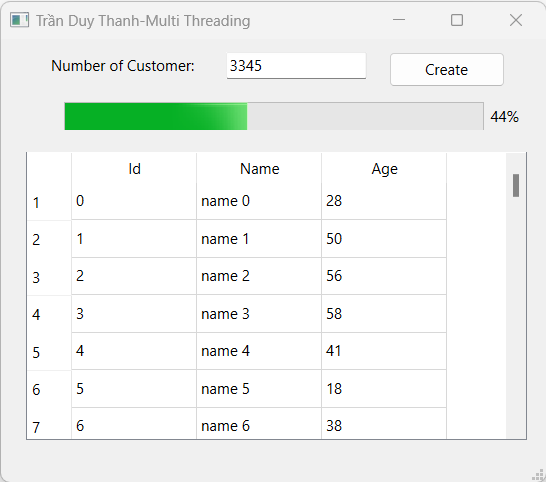
- Chương trình giả lập N số lượng Customer từ giao diện
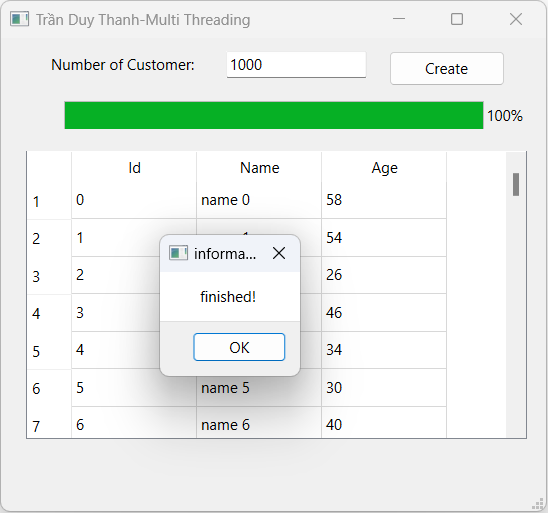
- Khi bấm nút “Create” chương trình sẽ sử dụng kỹ thuật đa tiến trình đã cập nhật giao diện QTableWidget, mỗi lần tiểu trình tạo một Customer ngẫu nhiên nó sẽ gửi về tiến trình chính (giao diện) hiển thị Customer lên giao diện, đồng thời cho biết tỉ lệ hoàn thành cập nhật giao diện
- Chẳng hạn ở trên ta thấy 44% tiến độ đã hoàn thành. Và trong quá trình thực hiện cập nhật giao diện thì người sử dụng có thể thao tác trên giao diện mà không bị treo.
- Bạn có thể áp dụng bài này trong việc tải dữ liệu từ các Restful API để nạp danh sách đối tượng lên giao diện theo thời gian thực. Ví dụ như nạp các danh sách Sản phẩm từ Restful API chẳng hạn.
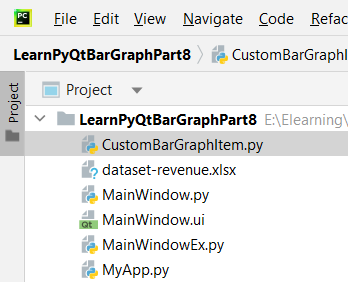
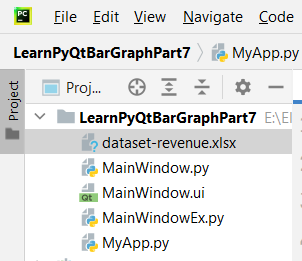
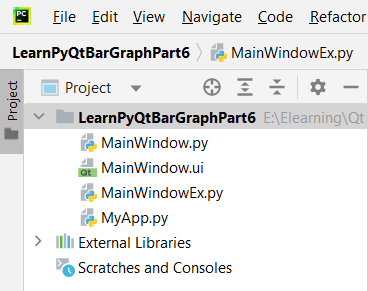
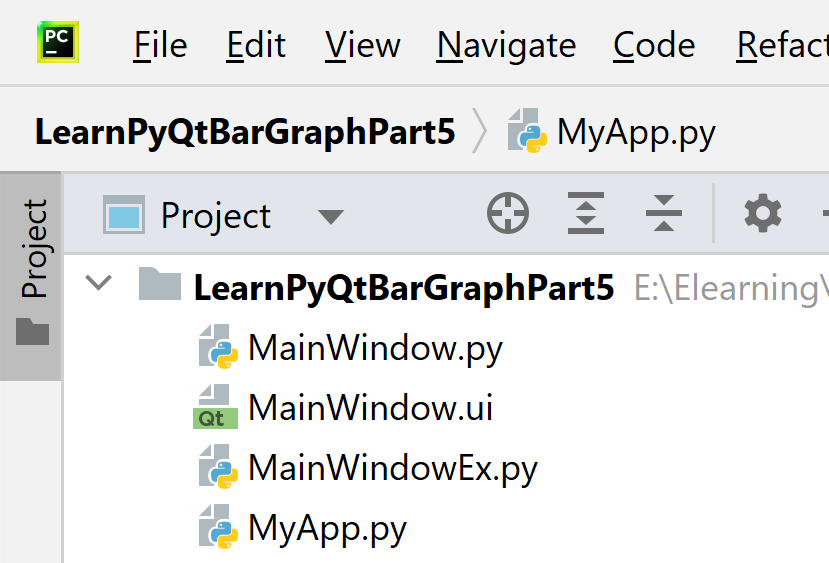
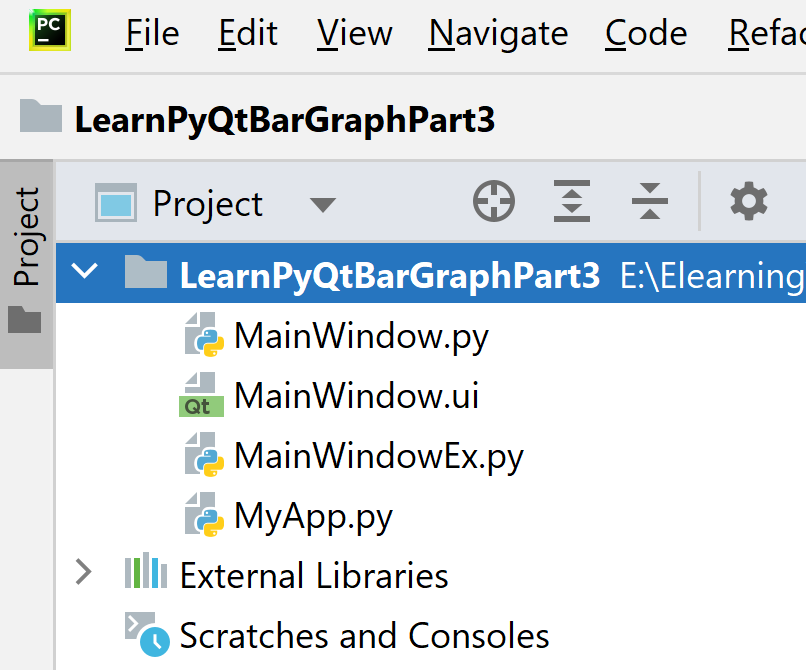
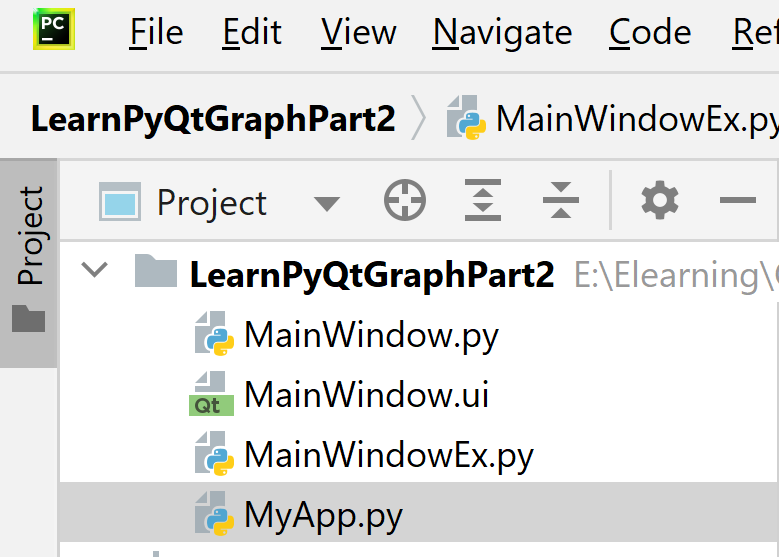
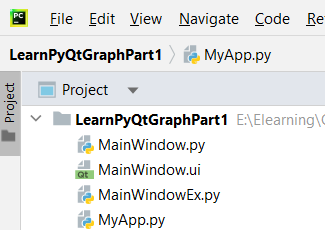
Bước 1: Tạo dự án “LearnMultithreadingPart2” có cấu trúc như dưới đây:
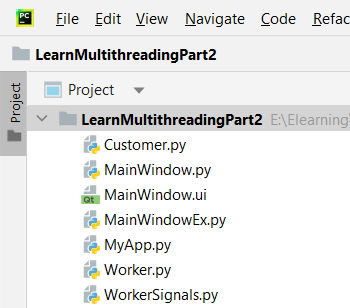
- “Customer.py” là file chứa lớp đối tượng Customer để chương trình mỗi lần thực thi sẽ tạo ra một Customer ngẫu nhiên trong tiểu trình rồi gửi về cho Main Thread cập nhật lên giao diện.
- “WorkerSignals.py” là lớp kế thừa từ QObject, khai báo các Signal để thực hiện call back gửi dữ liệu trở về giao diện chính để cập nhật giao diện thời gian thực
- “Worker.py” là lớp kế thừa từ QRunnable, nó dùng để tạo các đối tượng chạy đa tiến trình, trong quá trình xử lý nó sẽ thông qua WorkerSignals để gửi tín hiệu về cho màn hình chính cập nhật giao diện.
- “MainWindow.ui” là giao diện thiết kế tương tác người dùng bằng Qt Designer
- “MainWindow.py” là Generate Python code cho giao diện “MainWindow.ui”
- “MainWindowEx.py” là file mã lệnh kế thừa từ Generate Python Code để xử lý: Nạp giao diện, hiển thị chart, gán sự kiện và không bị lệ thuộc vào giao diện bị thay đổi sau này khi Generate lại code
- “MyApp.py” là file mã lệnh thực thi chương trình.
Dưới đây là Flow Chart xử lý đa tiến trình trong các mã lệnh ở các Lớp trong Project:
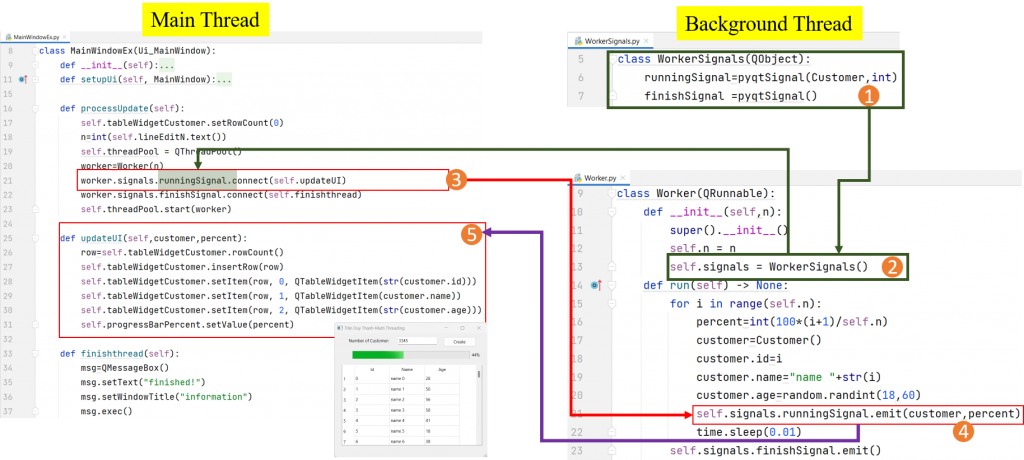
- Flow Chart ở trên Tui vẽ ra 5 bước tổng quan, Tui giải thích sơ lược để các bạn nắm:
- Step 1: Trong lớp WorkerSignals ta khai báo các Signal để làm nhiệm vụ bắn các tín hiệu từ Background Thread (chạy ngầm) qua Main Thread (UI)
- Step 2: Trong lớp Worker ta sẽ sử dụng đối tượng WorkerSignals ở bước 1, đối tượng này có 2 signal: biến runningSignal để bắn tín hiệu cập nhật dữ liệu cũng như tiến độ về cho MainThread để cập nhật giao diện thời gian thực, biến finishSignal sẽ bắn tín hiệu về MainThread để báo rằng tiến trình đã hoàn tất.
- Step 3: Trong Main Thread khai báo các đối tượng Worker, QThreadPool để thực thi đa tiến trình, nó cần báo cho Background Thread biết là khi bắn tín hiệu (khi gọi hàm emit) về cho Main Thread thì slot nào sẽ lắng nghe
- Step 4: Trong quá trình thực thi Background Thread, chương trình sẽ bắn tín hiệu về cho Main Thread thông qua hàm emit
- Step 5: Bất cứ khi nào Background Thread gọi hàm emit thì ngay lập tức slot được khai báo trong Main Thread sẽ nhận được tín hiệu từ Back ground Thread gửi về. Tùy thuộc vào WorkerSignals ta khai báo các đối số như thế nào thì ta truyền dữ liệu tương ứng. Ta chỉ có thể cập nhật giao diện ở Main Thread, không thể cập nhật giao diện ở Background Thread, đó là lý do vì sao ta phải bắn tín hiệu về cho Main Thread.
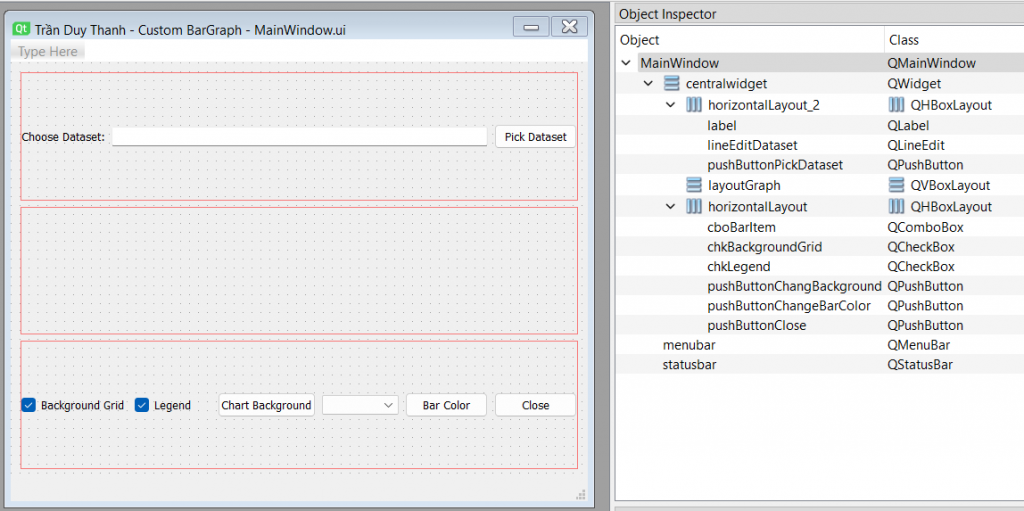
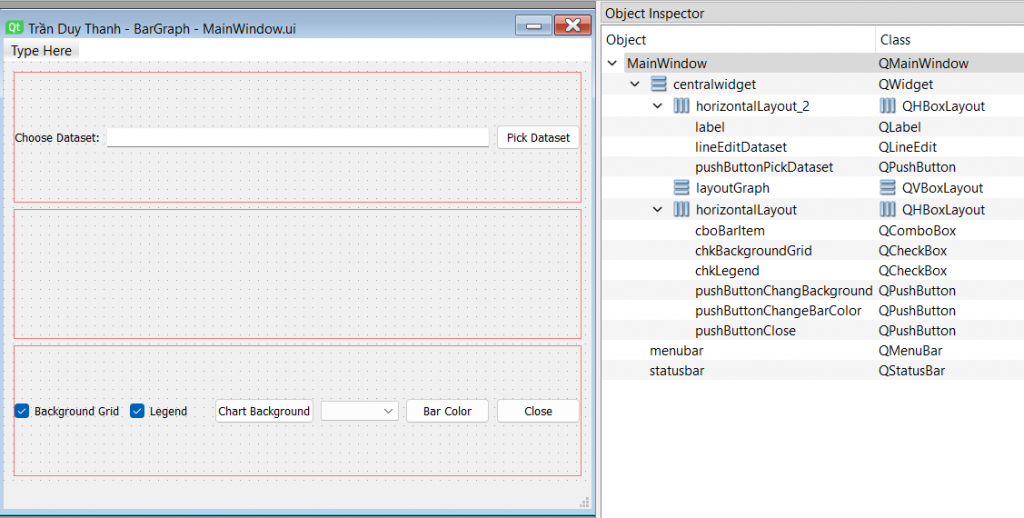
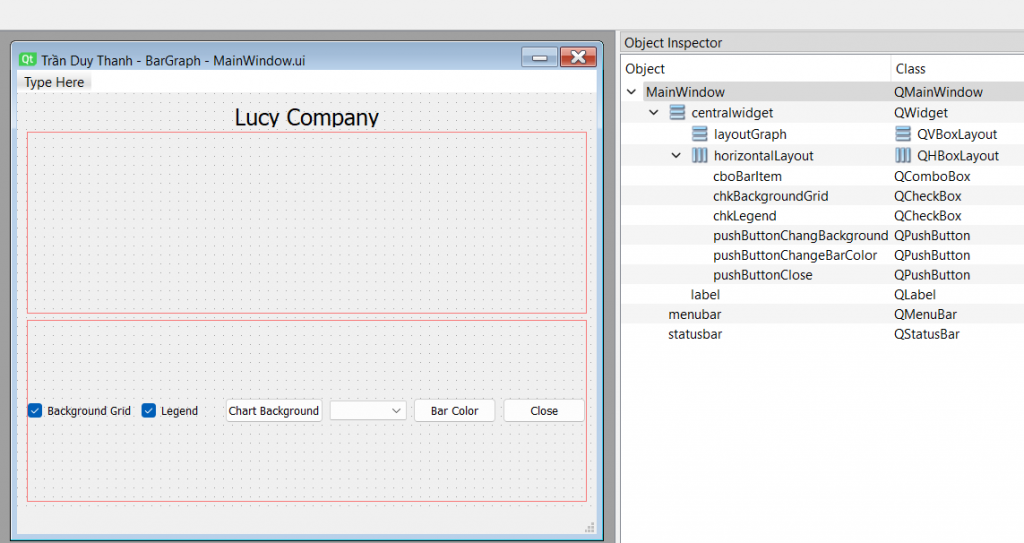
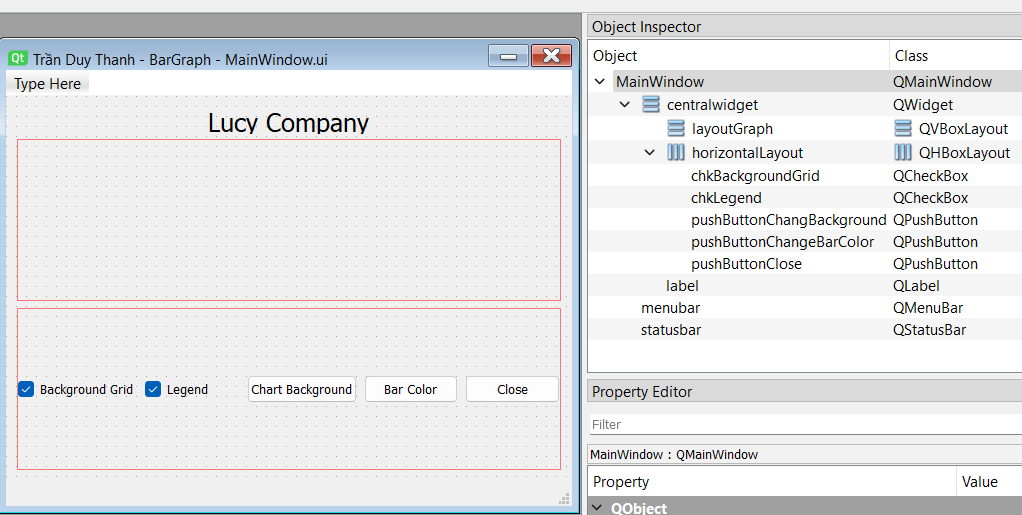
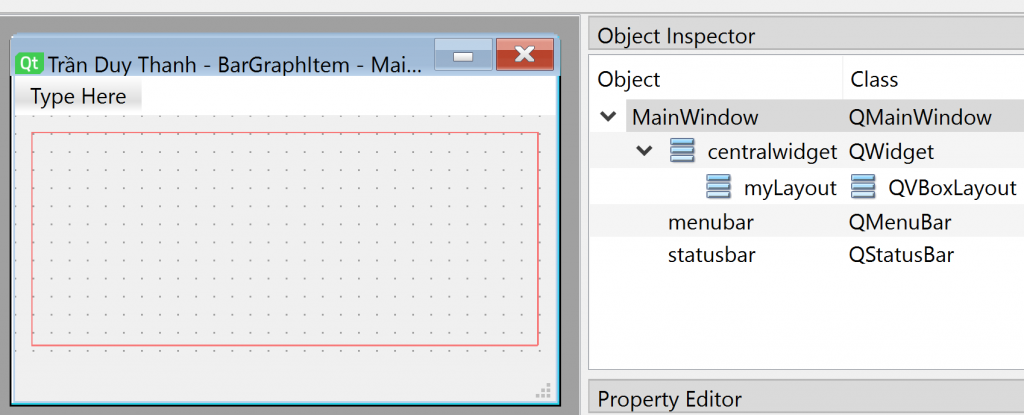
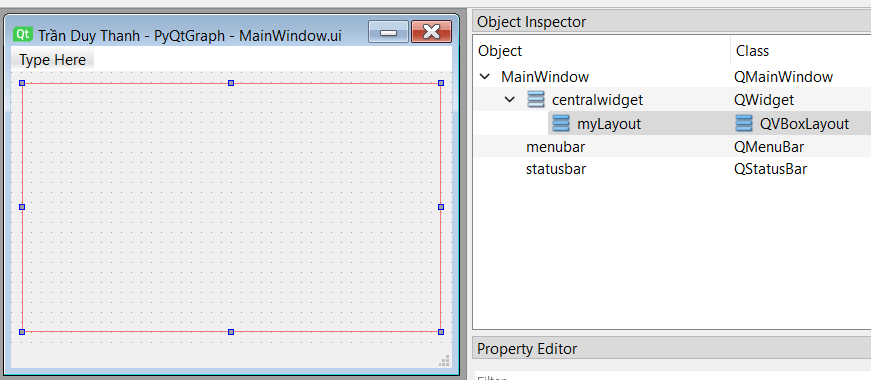
Bước 2: Thiết kế giao diện “MainWindow.ui” và đặt tên cho Widget/layout như hình dưới đây:
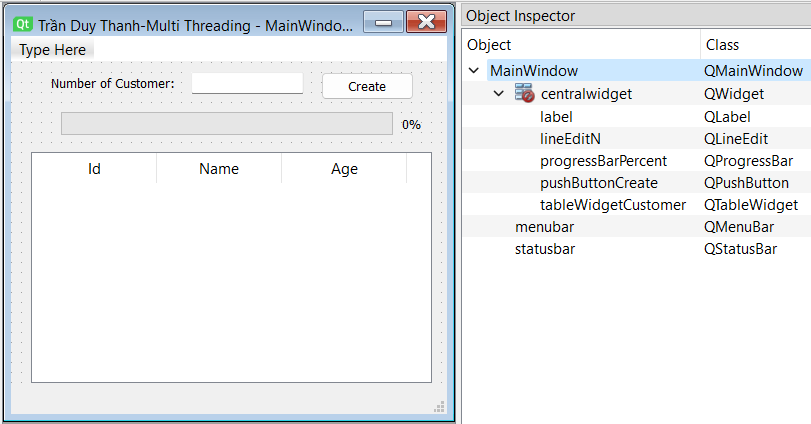
Bạn lần lượt kéo thả các Widget vào giao diện như trên, lưu ý việc lựa chọn các Layout cho phù hợp. Và bạn đặt tên các Widget như hình.
- QLineEdit (lineEditN) là ô nhập liệu
- QProgressBar (progressbarPercent) là thanh trạng thái đánh dấu quá trình xử lý được bao nhiêu %.
- QPushButton (pushButtonCreate) là widget sẽ ra lệnh để thực thi đa tiến trình
- QTableWidget (tableWidgetCustomer)
Bước 3: Generate Python Code cho “MainWindow.ui”, lúc này mã lệnh “MainWindow.py” tự động được tạo ra:
# Form implementation generated from reading ui file 'MainWindow.ui'
#
# Created by: PyQt6 UI code generator 6.4.2
#
# WARNING: Any manual changes made to this file will be lost when pyuic6 is
# run again.  Do not edit this file unless you know what you are doing.


from PyQt6 import QtCore, QtGui, QtWidgets


class Ui_MainWindow(object):
    def setupUi(self, MainWindow):
        MainWindow.setObjectName("MainWindow")
        MainWindow.resize(436, 378)
        self.centralwidget = QtWidgets.QWidget(parent=MainWindow)
        self.centralwidget.setObjectName("centralwidget")
        self.label = QtWidgets.QLabel(parent=self.centralwidget)
        self.label.setGeometry(QtCore.QRect(40, 10, 131, 21))
        self.label.setObjectName("label")
        self.lineEditN = QtWidgets.QLineEdit(parent=self.centralwidget)
        self.lineEditN.setGeometry(QtCore.QRect(180, 10, 113, 22))
        self.lineEditN.setObjectName("lineEditN")
        self.pushButtonCreate = QtWidgets.QPushButton(parent=self.centralwidget)
        self.pushButtonCreate.setGeometry(QtCore.QRect(310, 10, 93, 28))
        self.pushButtonCreate.setObjectName("pushButtonCreate")
        self.progressBarPercent = QtWidgets.QProgressBar(parent=self.centralwidget)
        self.progressBarPercent.setGeometry(QtCore.QRect(50, 50, 371, 23))
        self.progressBarPercent.setProperty("value", 0)
        self.progressBarPercent.setObjectName("progressBarPercent")
        self.tableWidgetCustomer = QtWidgets.QTableWidget(parent=self.centralwidget)
        self.tableWidgetCustomer.setGeometry(QtCore.QRect(20, 90, 401, 231))
        self.tableWidgetCustomer.setObjectName("tableWidgetCustomer")
        self.tableWidgetCustomer.setColumnCount(3)
        self.tableWidgetCustomer.setRowCount(0)
        item = QtWidgets.QTableWidgetItem()
        self.tableWidgetCustomer.setHorizontalHeaderItem(0, item)
        item = QtWidgets.QTableWidgetItem()
        self.tableWidgetCustomer.setHorizontalHeaderItem(1, item)
        item = QtWidgets.QTableWidgetItem()
        self.tableWidgetCustomer.setHorizontalHeaderItem(2, item)
        MainWindow.setCentralWidget(self.centralwidget)
        self.menubar = QtWidgets.QMenuBar(parent=MainWindow)
        self.menubar.setGeometry(QtCore.QRect(0, 0, 436, 26))
        self.menubar.setObjectName("menubar")
        MainWindow.setMenuBar(self.menubar)
        self.statusbar = QtWidgets.QStatusBar(parent=MainWindow)
        self.statusbar.setObjectName("statusbar")
        MainWindow.setStatusBar(self.statusbar)

        self.retranslateUi(MainWindow)
        QtCore.QMetaObject.connectSlotsByName(MainWindow)

    def retranslateUi(self, MainWindow):
        _translate = QtCore.QCoreApplication.translate
        MainWindow.setWindowTitle(_translate("MainWindow", "Trần Duy Thanh-Multi Threading"))
        self.label.setText(_translate("MainWindow", "Number of Customer:"))
        self.pushButtonCreate.setText(_translate("MainWindow", "Create"))
        item = self.tableWidgetCustomer.horizontalHeaderItem(0)
        item.setText(_translate("MainWindow", "Id"))
        item = self.tableWidgetCustomer.horizontalHeaderItem(1)
        item.setText(_translate("MainWindow", "Name"))
        item = self.tableWidgetCustomer.horizontalHeaderItem(2)
        item.setText(_translate("MainWindow", "Age"))
Bước 4: Viết mã lệnh cho “Customer.py“
class Customer:
    def __init__(self,id=0,name=None,age=0):
        self.id=id
        self.name=name
        self.age=age
Lớp Customer được định nghĩa với 4 thuộc tính: id, name, age. Với constructor nhận vào 4 biến có giá trị mặc định như trên.
Bước 5: Viết mã lệnh cho “WorkerSignals.py“
from PyQt6.QtCore import pyqtSignal, QObject

from Customer import Customer

class WorkerSignals(QObject):
    runningSignal=pyqtSignal(Customer,int)
    finishSignal =pyqtSignal()
Lớp WorkerSignals được kế thừa từ QObject, lớp này Tui khai báo 2 biến đối tượng có kiểu pyqtSignal:
- runningSignal là signal để truyền tín hiệu trong quá trình thực hiện cập nhật giao diện thời gian thực. Signal này truyền 2 đối số, đối số 1 là đối tượng Customer hiển thị lên QTableWidget, đối số 2 là percent thực hiện quá trình cập nhật giao diện thời gian thực
- finishSignal là signal thông báo đã hoàn tất thực hiện chạy đa tiến trình
Bước 6: Viết mã lệnh cho “Worker.py“
import random
import time

from PyQt6.QtCore import QRunnable

from Customer import Customer
from WorkerSignals import WorkerSignals

class Worker(QRunnable):
    def __init__(self,n):
        super().__init__()
        self.n = n
        self.signals = WorkerSignals()
    def run(self) -> None:
        for i in range(self.n):
            percent=int(100*(i+1)/self.n)
            customer=Customer()
            customer.id=i
            customer.name="name "+str(i)
            customer.age=random.randint(18,60)
            self.signals.runningSignal.emit(customer,percent)
            time.sleep(0.01)
        self.signals.finishSignal.emit()
Lớp Worker được kế thừa từ lớp QRunnable, lớp này Tui định nghĩa 2 hàm:
- Constructor nhận vào đối số n là số lượng Customer giả lập mà người dùng muốn hiển thị trên giao diện QTableWidget. Nó cũng khởi tạo đối tượng WorkerSignals để sử dụng cho việc truyền tin về màn hình chính (Main Thread), Chúng ta chỉ có thể cập nhật giao diện ở Main Thread
- override hàm run, hàm này là chạy long time, Tui đang giả lập nó 1 vòng lặp để tạo ngẫu nhiên các đối tượng, và tính percent. Sau đó dùng biến singal runningSignal để truyền tín hiệu cùng với dữ liệu về cho Main Thread thông qua hàm emit. Mỗi lần lặp Tui cho nó nghỉ 0.01 giây.
- Cuối cùng khi kết thúc vòng lặp Tui gọi finishSignal để truyền tín hiệu là kết thúc tiến trình
Bước 7: Viết mã lệnh cho “MainWindowEx.py”
Khởi tạo Constructor như bên dưới, và override hàm setupUi để thiết lập giao diện cũng như gọi signal cho Button create
from PyQt6.QtCore import QThreadPool
from PyQt6.QtWidgets import QTableWidgetItem, QMessageBox

from MainWindow import Ui_MainWindow
from Worker import Worker


class MainWindowEx(Ui_MainWindow):
    def __init__(self):
        super().__init__()
    def setupUi(self, MainWindow):
        super().setupUi(MainWindow)
        self.MainWindow=MainWindow
        self.pushButtonCreate.clicked.connect(self.processUpdate)
Hàm processUpdate sẽ tạo đối tượng QThreadPool để kích hoạt tiến trình bằng hàm start(worker):
def processUpdate(self):
    self.tableWidgetCustomer.setRowCount(0)
    n=int(self.lineEditN.text())
    self.threadPool = QThreadPool()
    worker=Worker(n)
    worker.signals.runningSignal.connect(self.updateUI)
    worker.signals.finishSignal.connect(self.finishthread)
    self.threadPool.start(worker)
Trong hàm processUpdate này ta khai báo đối tượng worker, truyền n là số lượng Customer mà người giả lập để hiển thị lên QTableWidget.
Đồng thời ta cần gán các signal: runningSignal, finishSignal thông qua các slot updateUI và finishthred; Lúc này khi bên Worker thực hiện gọi các lệnh emit thì bên MainThread này sẽ tự động thực hiện chính xác các Slot.
Hàm updateUI() để hiển thị các Customer lên QTableWidget theo thời gian thực và cập nhật percent tiến độ:
def updateUI(self,customer,percent):
    row=self.tableWidgetCustomer.rowCount()
    self.tableWidgetCustomer.insertRow(row)
    self.tableWidgetCustomer.setItem(row, 0, QTableWidgetItem(str(customer.id)))
    self.tableWidgetCustomer.setItem(row, 1, QTableWidgetItem(customer.name))
    self.tableWidgetCustomer.setItem(row, 2, QTableWidgetItem(str(customer.age)))
    self.progressBarPercent.setValue(percent)
Mỗi lần bên Worker thực hiện lệnh:
self.signals.runningSignal.emit(customer,percent)
Thì hàm updateUI sẽ tự động được thực thi.
Hàm finishthread() để lắng nghe khi nào thì Worker truyền tín hiệu hoàn tất tiến trình:
def finishthread(self):
    msg=QMessageBox()
    msg.setText("finished!")
    msg.setWindowTitle("information")
    msg.exec()
Khi bên Worker thực thi lệnh:
self.signals.finishSignal.emit()
Thì hàm finishthread sẽ được thực hiện
Mã lệnh đầy đủ của MainWindowEx.py:
from PyQt6.QtCore import QThreadPool
from PyQt6.QtWidgets import QTableWidgetItem, QMessageBox

from MainWindow import Ui_MainWindow
from Worker import Worker


class MainWindowEx(Ui_MainWindow):
    def __init__(self):
        super().__init__()
    def setupUi(self, MainWindow):
        super().setupUi(MainWindow)
        self.MainWindow=MainWindow
        self.pushButtonCreate.clicked.connect(self.processUpdate)

    def processUpdate(self):
        self.tableWidgetCustomer.setRowCount(0)
        n=int(self.lineEditN.text())
        self.threadPool = QThreadPool()
        worker=Worker(n)
        worker.signals.runningSignal.connect(self.updateUI)
        worker.signals.finishSignal.connect(self.finishthread)
        self.threadPool.start(worker)

    def updateUI(self,customer,percent):
        row=self.tableWidgetCustomer.rowCount()
        self.tableWidgetCustomer.insertRow(row)
        self.tableWidgetCustomer.setItem(row, 0, QTableWidgetItem(str(customer.id)))
        self.tableWidgetCustomer.setItem(row, 1, QTableWidgetItem(customer.name))
        self.tableWidgetCustomer.setItem(row, 2, QTableWidgetItem(str(customer.age)))
        self.progressBarPercent.setValue(percent)

    def finishthread(self):
        msg=QMessageBox()
        msg.setText("finished!")
        msg.setWindowTitle("information")
        msg.exec()

    def show(self):
        self.MainWindow.show()
Bước 8: Viết mã lệnh “MyApp.py” để thực thi chương trình:
from PyQt6.QtWidgets import QApplication, QMainWindow
from MainWindowEx import MainWindowEx
app=QApplication([])
myWindow=MainWindowEx()
myWindow.setupUi(QMainWindow())
myWindow.show()
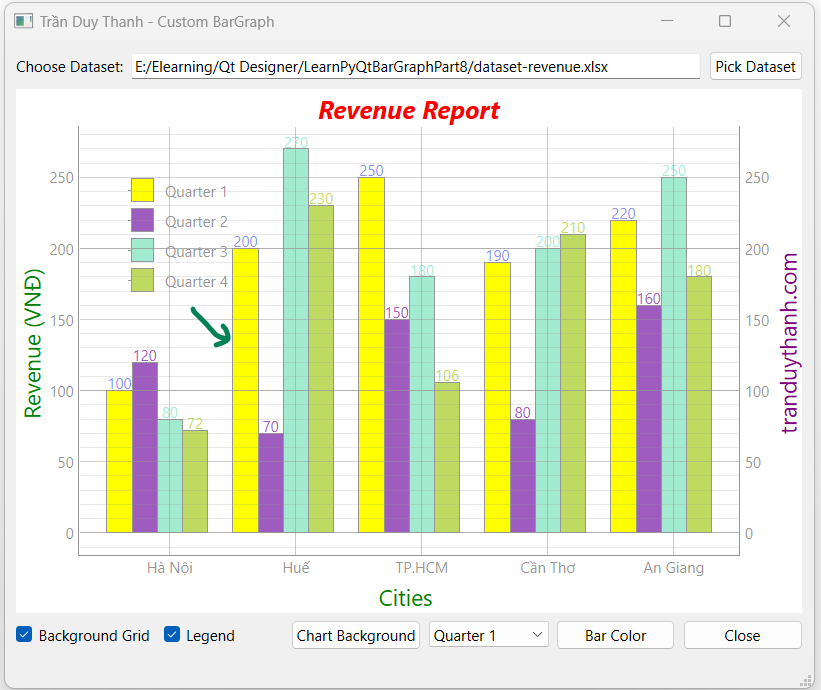
app.exec()Thực thi MyApp.py ta có kết quả, Chạy phần mềm lên:
Như vậy chúng ta đã làm xong xử lý đa tiến trình để cập nhật giao diện thời gian thực, các bạn ôn tập được cách khai báo WorkerSignals, Worker cũng như ôn tập cách sử dụng QThreadPool để kích hoạt Worker và ứng dụng nó vào cập nhật giao diện thời gian thực trên QTableWidget.
Soure code của bài này các bạn tải ở đây:
https://www.mediafire.com/file/oudzu7kgjil8n3k/LearnMultithreadingPart2.rar/file
Bài học sau Tui sẽ hướng dẫn các bạn xử lý đa tiến trình gồm nhiều Worker thực hiện đồng thời để tải dữ liệu Online nội dung các Website trên internet. Và cập nhật dữ liệu thời gian thực cho QProgressBar trong QTableWidget cùng với lưu nội dung tải được xuống ổ cứng. Các bạn chú ý theo dõi
Chúc các bạn thành công